
The Moon’s phase and libration during 2013
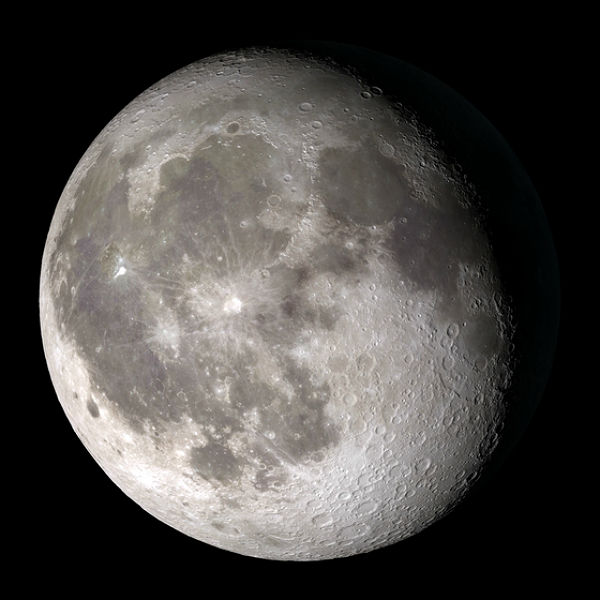
Image credit: GSFC Scientific Visualization Studio
New visualization from Goddard’s Scientific Visualization Studio shows the moon’s phase and libration throughout the year 2013, at hourly intervals. Each frame represents one hour. In addition, this visualization also shows other relevant information, including moon orbit position, subearth and subsolar points, distance from the Earth. Seeing the entire year compressed down to 5 minutes, we can see the changes in libration, and axis tilt — as well as Moon’s phases.
If you to find out anywhere what they Moon will be doing, check out Universe Today’s Phases of the Moon app, – available on iPhone or Android.
Scientific Visualization Studio tool (GSFC)
Commenting rules and guidelines
We value the thoughts and opinions of our readers and welcome healthy discussions on our website. In order to maintain a respectful and positive community, we ask that all commenters follow these rules.