
What lies beneath the Antarctic ice sheet
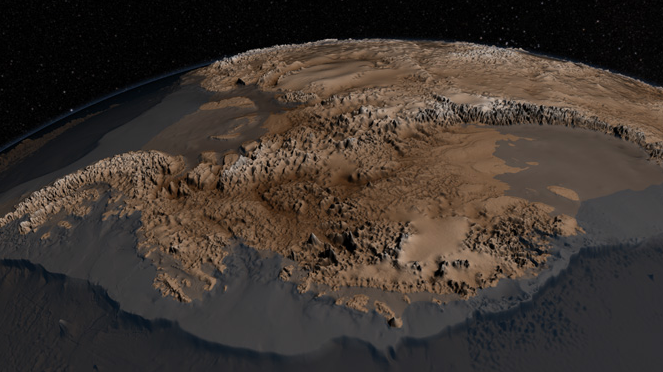
Featured image: The topography map, called Bedmap2, was compiled by the British Antarctic Survey and incorporates millions of new measurements, including substantial data sets from NASA's ICESat satellite and an airborne mission called Operation IceBridge. Credit: NASA's Goddard Space Flight Center
NASA has released a new product called Bedmap2 with clear picture of Antarctica from the ice surface down to the bedrock below. Up until now, researchers used 10 years old collection of Antarctic data.
The product was a result of work led by the British Antarctic Survey, where researchers compiled decades worth of geophysical measurements, such as surface elevation measurements from NASA's Ice, Cloud and Land Elevation Satellite, known as ICESat, and ice thickness data collected by Operation IceBridge.
With effects ranging from influencing ocean currents to raising sea level, Antarctica plays a large role in the global climate system. Researchers are using a variety of methods to understand how Antarctica will react to a changing climate, but limited information on ice thickness and what lies beneath the ice makes this work challenging. The data was published recently in the journal The Cryosphere, and scientists now have a new detailed map of the frozen continent.
It is made free to scientific community – Bedmap2: improved ice bed, surface and thickness datasets for Antarctica. Find it here.
The volume and distribution of ice in Antarctica are fundamental factors in determining the future behaviour of the ice sheets and their potential contribution to sea-level rise. Furthermore, the detailed form of the subglacial landscape and seafloor hold a record of the tectonic and geomorphic processes that created the Antarctic continent. Bedmap2 brings together the collective efforts of an international community of surveyors, since the beginning of the scientific era in Antarctica, to map the ice sheets and underlying landscape with an unprecedented combination of detail and extent.
Bedmap2, like the original Bedmap released 10 years ago, is a collection of three datasets—surface elevation, ice thickness and bedrock topography. Over the past decade there have been many Antarctic surveys, which vastly increased the amount of available data. Researchers used data from satellites, aircraft and surface-based surveys to build a data product with higher resolution, greater coverage and improved precision.
Both Bedmap and Bedmap2 are laid out as grids covering the entire continent, but with a tighter grid spacing, Bedmap2 includes many surface and sub-ice features too small to be seen in the previous dataset. The millions of additional data points in Bedmap2 also cover a larger percentage of Antarctica. Additionally, the extensive use of GPS data in more recent surveys improves the precision of the new dataset. Improvements in resolution, coverage and precision will lead to more accurate calculations of ice volume and potential contribution to sea level rise.
Total ice volume and sea level contribution remain similar to calculations using the original Bedmap, but Antarctica's average bedrock depth, deepest point and ice thickness estimates have all increased.
Peter Fretwell, BAS scientist and lead author, said the new dataset increases our knowledge of the sub-glacial environment and will be helpful to future research on the Antarctic ice sheet. "It will be an important resource for the next generation of ice sheet modelers, physical oceanographers and structural geologists," he said.
NASA contributed significant amounts of data on surface elevation, ice shelf limits and ice thickness. For example, measurements from three Operation IceBridge airborne campaigns make up about 12 percent of the 25 million ice thickness data points gathered by more than 200 airborne campaigns over the past 50 years.
IceBridge uses an ice-penetrating radar instrument known as the Multichannel Coherent Radar Depth Sounder to gather data on ice thickness and subglacial topography. MCoRDS, operated by the Center for the Remote Sensing of Ice Sheets at the University of Kansas, sends radar signals down through the ice and records the angle and timing of returning waves to image the ice surface, internal layering and the bedrock below.
NASA is making its data freely available to researchers, and is leading a positive trend with researchers. "We hope that other partners will also go down this road," said Fretwell. Collecting radar sounding data over Antarctica is an expensive effort, which has led some researchers to be understandably protective. This could change, however, as more researchers make use of freely available data.
"More and more people in the research community realize the tremendous value of making data freely available," said Michael Studinger, IceBridge project scientist at NASA Goddard.
Source: NASA
I'm a dedicated researcher, journalist, and editor at The Watchers. With over 20 years of experience in the media industry, I specialize in hard science news, focusing on extreme weather, seismic and volcanic activity, space weather, and astronomy, including near-Earth objects and planetary defense strategies. You can reach me at teo /at/ watchers.news.
Commenting rules and guidelines
We value the thoughts and opinions of our readers and welcome healthy discussions on our website. In order to maintain a respectful and positive community, we ask that all commenters follow these rules.