
Satellites measure increase of Sun’s energy absorbed in the Arctic
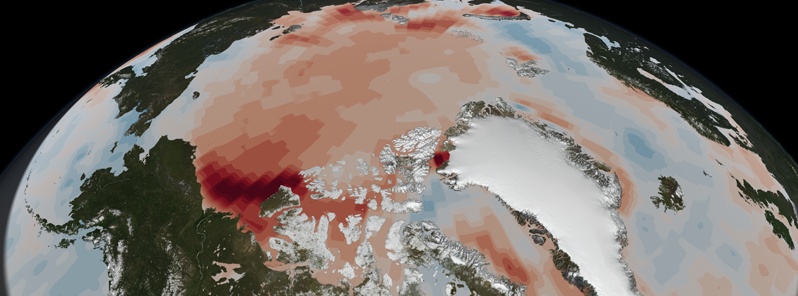
Image credit: NASA Goddard's Scientific Visualization Studio/Lori Perkins
NASA satellite instruments have observed a marked increase in solar radiation absorbed in the Arctic since the year 2000 – a trend that aligns with the steady decrease in Arctic sea ice during the same period.
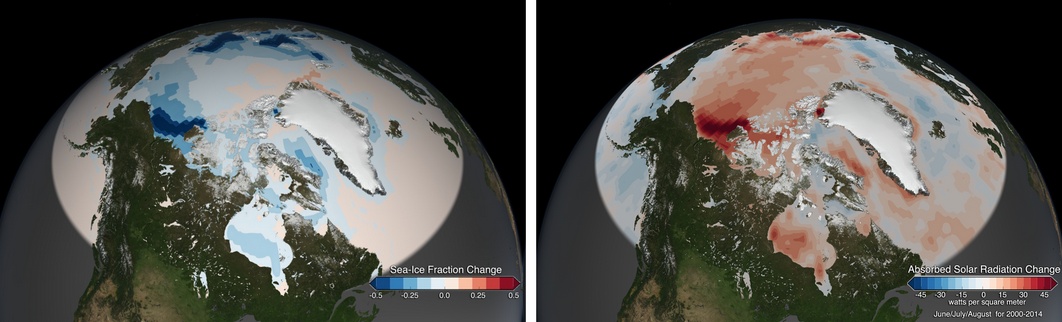
While sea ice is mostly white and reflects the sun’s rays, ocean water is dark and absorbs the sun’s energy at a higher rate. A decline in the region’s albedo – its reflectivity, in effect – has been a key concern among scientists since the summer Arctic sea ice cover began shrinking in recent decades. As more of the sun’s energy is absorbed by the climate system, it enhances ongoing warming in the region, which is more pronounced than anywhere else on the planet.
Norman Loeb of NASA's Langley Research Center said that since the year 2000, the rate of absorbed solar radiation in the Arctic in June, July and August has increased by five percent. The measurement is made by NASA’s Clouds and the Earth’s Radiant Energy System (CERES) instruments, which fly on multiple satellites.
While a five percent increase may not seem like much, consider that the rate globally has remained essentially flat during that same time. No other region on Earth shows a trend of potential long-term change.
The Arctic Ocean is absorbing more of the sun's energy in recent years as white, reflective sea ice melts and darker ocean waters are exposed. The increased darker surface area during the Arctic summer is responsible for a 5 percent increase in absorbed solar radiation since 2000. Image credit: NASA Goddard's Scientific Visualization Studio/Lori Perkins
When averaged over the entire Arctic Ocean, the increase in the rate of absorbed solar radiation is about 10 Watts per square meter. This is equivalent to an extra 10-watt light bulb shining continuously over every 10.76 square feet of Arctic Ocean for the entire summer.
Regionally, the increase is even greater, Loeb said. Areas such as the Beaufort Sea, which has experienced the some of the most pronounced decreases in sea-ice coverage, show a 50 watts per square meter increase in the rate of absorbed solar radiation.
“Advances in our understanding of Arctic climate change and the underlying processes that influence it will depend critically upon high quality observations like these from CERES,” Loeb said.
As a region, the Arctic is showing more dramatic signs of climate change than any other spot on the planet. These include a warming of air temperatures at a rate two to three times greater than the rest of the planet and the loss of September sea ice extent at a rate of 13 percent per decade.
While these CERES measurements could ultimately become another of those signs of dramatic climate change, right now scientists say they have obtained the bare minimum of a data record needed to discern what’s happening over the long term.
Getting data beyond 15 years will allow scientists to better assess if recent trend falls outside the realm of natural variability, said Jennifer Kay, an atmospheric scientist at the Cooperative Institute for Research and Environmental Science at the University of Colorado.
“We need long time series to detect climate change signals over the internal variability. For example, observed sea ice loss over the last 30 years cannot be explained by natural variability alone.” Kay said. “Fifteen years is long, but climate is often defined as the average over 30 years – so we are only half-way there with the CERES observations.”
Kay and colleagues have also analyzed satellite observations of Arctic clouds during this same 15-year period. Kay’s research shows summer cloud amounts and vertical structure are not being affected by summer sea ice loss. While surprising, the observations show that the bright sea ice surface is not automatically replaced by bright clouds. Indeed, sea ice loss, not clouds, explain the increases in absorbed solar radiation measured by CERES.
Increasing absorbed solar radiation is causing multiple changes in the sea ice cover, said Walt Meier, a sea ice scientist from NASA’s Goddard Space Flight Center, Greenbelt, Maryland. Two of those changes include the timing of the beginning of the melt season each year and the loss of older, thicker sea ice.
The onset of the melt season in the high Arctic is now on average seven days earlier than it was in 1982, Meier said. Earlier melting can lead to increased solar radiation absorption. This is one step in a potential feedback cycle of warming leading to melting, melting leading to increased solar radiation absorption, and increased absorption leading to enhanced warming.
Since 2000, the Arctic has lost 1.4 million square kilometers (541,000 square miles) of older ice that is more than 3 meters thick, which during winter has essentially been replaced by ice that is less than 2 meters thick, according to data provided by Mark Tschudi at the University of Colorado. Once again, Meier said, this trend is a step in a feedback cycle.
“Having younger and thus thinner ice during winter makes the system more vulnerable to ice loss during the summer melt season,” Meier said.
CERES instruments are currently flying on the Terra, Aqua and Suomi-NPP satellites. The Terra satellite launched Dec. 18, 1999, and CERES first started collecting Arctic data in 2000 so 2015 will mark 15 continuous years of CERES measurements over the Arctic.
The instruments include three radiometers – one measuring solar radiation reflected by Earth (shortwave), one measuring thermal infrared radiation emitted by Earth (longwave), and one measuring all outgoing radiation, whether emitted or reflected.
Source: NASA/Goddard
The Watchers team and our contributors bring the latest on extreme weather, earthquakes, volcanic eruptions, space weather, and all things science. We're all about making sense of the natural world and keeping you informed on what’s happening. Got a tip or a question? Hit us up using the form at newstips!
Please go to plantsneedco2.org and get and education. Also should read john casey book called Cold Sun. We are going into and ice age idiots. Not a warming period.
These graphics with all of the bright reds&oranges(similar to that global CO2map that
made the earth appear to be in the midst of a gargantuan heat wave!)are close to overt
propaganda…,its not just what happens in the Arctic Circle,but the entire Northern Hemisphere that counts…,which of course is starting Winter,& albeit a cold one at that!
Does this means that Algore will have to find a way to tax solar radiation??