
Arctic sea ice extent above levels not seen since 2013
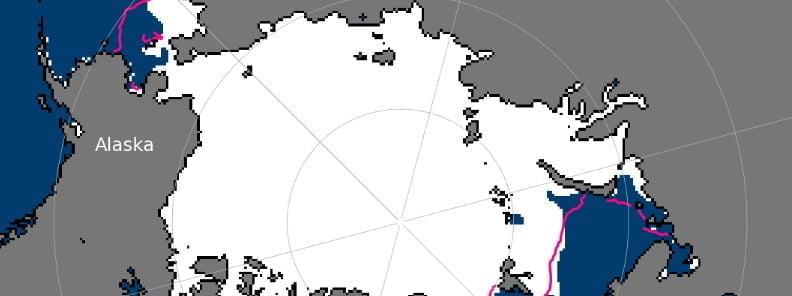
Image credit: NSIDC
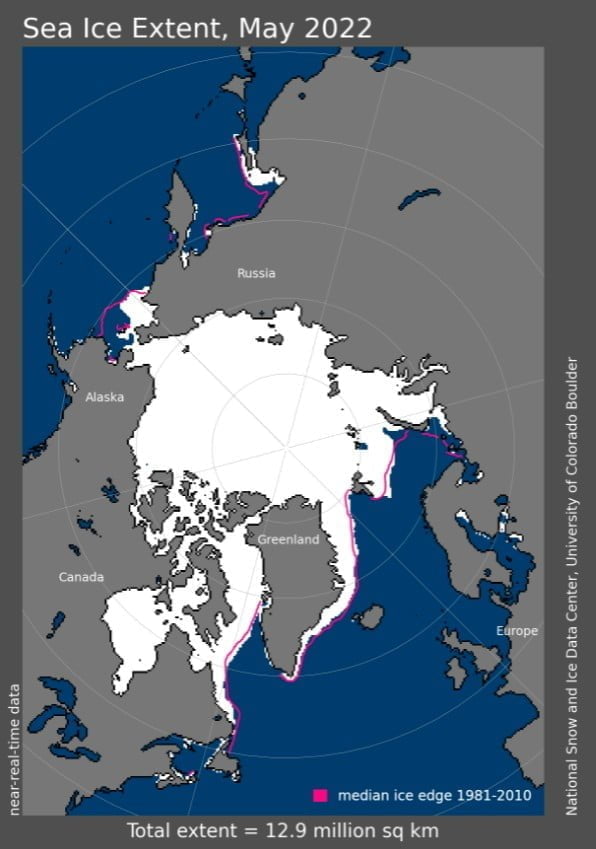
Arctic’s seasonal sea ice loss began more slowly in May 2022 than in the recent years as air temperatures were closer to the 1981 to 2010 average. The month ended with the highest sea ice extent since 2013 – the 14th lowest in the satellite record.
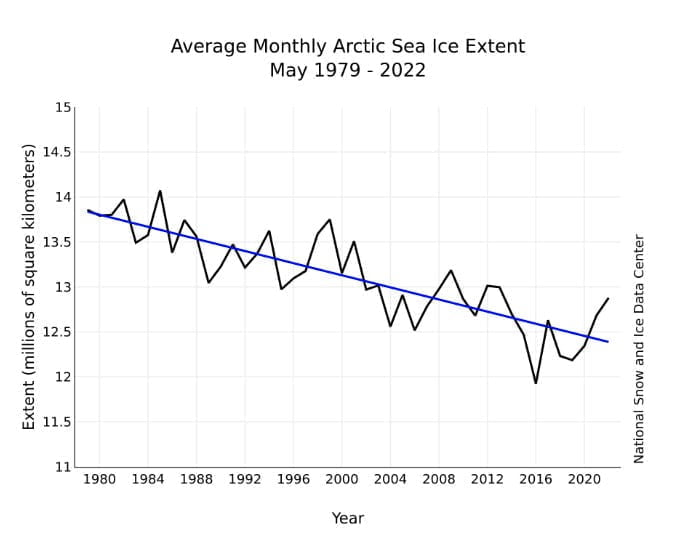
The average Arctic sea ice extent for the month of May 2022 was the highest May extent since 2013 – at 12.88 million km2 (4.97 million mi2) or 410 000 km2 (158 000 mi2) below the 1981 to 2010 average, the National Snow & Ice Data Center (NSIDC) reports.1
As was the case for April, sea ice extent was slow to decline, losing only 1.28 million mi2 (494 000 mi2) during the month.
Ice loss in May occurred primarily in the Bering Sea, the Barents Sea, and within the Baffin Bay and the Davis Strait.
However, several openings, or polynyas, in the pack ice have started to form, particularly within the eastern Beaufort Sea, the Chukchi Sea, the Laptev Sea, and around Franz Joseph Land in the northern Barents Sea.
Ice also started to pull back from the shores of Russia in the Kara Sea.
In Hudson Bay, the ice started to melt out in the south within James Bay and off of Southampton Island in the north.
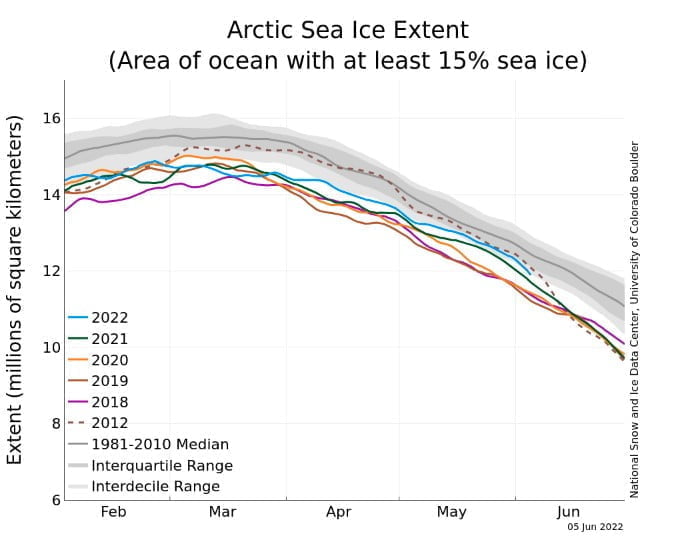
Overall, the daily sea ice extent tracked within the interdecile range (encompassing 90% of the 1981 to 2010 daily values) for much of the month.
By the end of the month, the extent was close to the sea ice extent observed in late May 2012.
The relatively extensive ice cover for this time of year was largely the result of lower than average temperatures in the Baffin Bay. Winds from the north also slowed the retreat of ice in the Bering and Barents Seas.
Within the Arctic Ocean, air temperatures at the 925 hPa level (about 760 m / 2 500 feet above the surface) were near average over most of the region in May, and 1 – 5 °C (2 – 9 °F) above the 1981 to 2010 average along the coast of the Kara and East Siberian Seas, the East Greenland Sea, and the Canadian Archipelago.
Areas where openings formed within the ice cover were dominated by off-shore ice motion, pushing ice poleward as well as toward Fram Strait.
This offshore ice motion is largely driven by a pattern of low sea level pressure over Eurasia coupled with high pressure over the Pacific sector of the Arctic.
A consequence of summer sea ice loss is that the ocean absorbs more of the Sun’s energy, NSIDC report states.
Before the ice can form again in the fall and winter, this heat has to be released back to the atmosphere which is one of the reasons why the Arctic is warming more strongly than the global average, particularly in the fall season.
Studies have suggested this amplified Arctic warming may be impacting weather systems at lower latitudes.
One hypothesis is that the warm air released from the surface propagates up through the atmosphere and disrupts the polar vortex in the stratosphere.
This can lead to cold air outbreaks, such as in February 2021 when cold Arctic air reached as far south as Texas, causing the failure of the power grid, billions of dollars in damage, and loss of lives.2
Proposed links between Arctic warming and mid-latitude weather nevertheless remain controversial and are far from settled.
Another recent study3 reveals a correlation between Arctic sea ice extent (averaged from July to October) and conditions favoring California wildfires after removing the long-term trend in both the sea ice and a regional fire-favorable weather conditions index.
However, correlation is not causation.
References:
1 On the high side of low – NSIDC – June 5, 2022
2 Texas 2021 deep freeze left nearly 200 people dead, new analysis shows – The Watchers – April 7, 2021
3 “Increasing large wildfires over the western United States linked to diminishing sea ice in the Arctic” – Zou, Y., P. J. Rasch, H. Wang, et al. 2021. – Nature Communications. doi:10.1038/s41467-021-26232-9
I'm a dedicated researcher, journalist, and editor at The Watchers. With over 20 years of experience in the media industry, I specialize in hard science news, focusing on extreme weather, seismic and volcanic activity, space weather, and astronomy, including near-Earth objects and planetary defense strategies. You can reach me at teo /at/ watchers.news.
Commenting rules and guidelines
We value the thoughts and opinions of our readers and welcome healthy discussions on our website. In order to maintain a respectful and positive community, we ask that all commenters follow these rules.