
Sea ice extent sinks to record lows at both poles
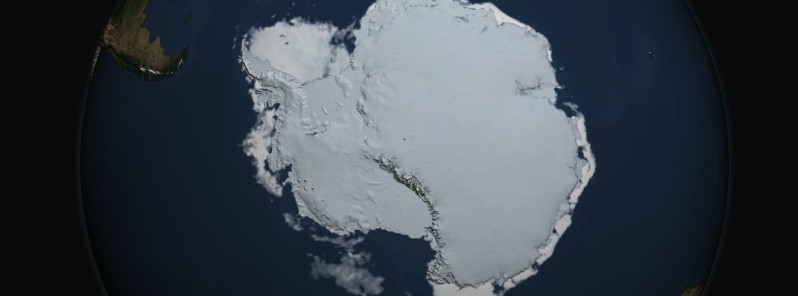
Image credit: NASA/GSFC
Arctic sea ice appears to have reached on March 7 a record low wintertime maximum extent. This is the lowest maximum in the 38-year satellite record. On the opposite side of the planet, on March 3 sea ice around Antarctica hit its lowest extent ever recorded by satellites at the end of summer in the Southern Hemisphere, a surprising turn of events after decades of moderate sea ice expansion.
On February 13, 2016, the combined Arctic and Antarctic sea ice numbers were at their lowest point since satellites began to continuously measure sea ice in 1979. Total polar sea ice covered 16.21 million km2 (6.26 million mi2), which is 2 million km2 (790 000 mi2) less than the average global minimum extent for 1981-2010 – the equivalent of having lost a chunk of sea ice larger than Mexico, NASA’s Goddard Space Flight Center reports.
The ice floating on top of the Arctic Ocean and surrounding seas shrinks in a seasonal cycle from mid-March until mid-September. As the Arctic temperatures drop in the autumn and winter, the ice cover grows again until it reaches its yearly maximum extent, typically in March. The ring of sea ice around the Antarctic continent behaves in a similar manner, with the calendar flipped: it usually reaches its maximum in September and its minimum in February.
This winter, a combination of warmer-than-average temperatures, winds unfavorable to ice expansion, and a series of storms halted sea ice growth in the Arctic. This year’s maximum extent, reached on March 7 at 14.42 million km2 (5.57 million mi2), is 97 000 km2 (37 000 mi2) below the previous record low, which occurred in 2015, and 1.22 million km2 (471 000 mi2) smaller than the average maximum extent for 1981-2010.
“We started from a low September minimum extent,” Walt Meier, a sea ice scientist at Goddard said. “There was a lot of open ocean water and we saw periods of very slow ice growth in late October and into November, because the water had a lot of accumulated heat that had to be dissipated before ice could grow. The ice formation got a late start and everything lagged behind – it was hard for the sea ice cover to catch up.”
The Arctic’s sea ice maximum extent has dropped by an average of 2.8% per decade since 1979. The summertime minimum extent losses are nearly five times larger: 13.5%. Besides shrinking in extent, the sea ice cap is also thinning and becoming more vulnerable to the action of ocean waters, winds and warmer temperatures.
This year’s record low sea ice maximum extent might not necessarily lead to a new record low summertime minimum extent, since weather has a great impact on the melt season’s outcome, Meier said. “But it’s guaranteed to be below normal.”
In Antarctica, this year’s record low annual sea ice minimum of 815 000 mi2 (2.11 million km2) was 71 000 mi2 (184 000 km2) below the previous lowest minimum extent in the satellite record, which occurred in 1997.
Antarctic sea ice saw an early maximum extent in 2016, followed by a very rapid loss of ice starting in early September. Since November, daily Antarctic sea ice extent has continuously been at its lowest levels in the satellite record. The ice loss slowed down in February.
This year’s record low happened just two years after several monthly record high sea ice extents in Antarctica and decades of moderate sea ice growth.
“There’s a lot of year-to-year variability in both Arctic and Antarctic sea ice, but overall, until last year, the trends in the Antarctic for every single month were toward more sea ice,” said Claire Parkinson, a senior sea ice researcher at Goddard. “Last year was stunningly different, with prominent sea ice decreases in the Antarctic. To think that now the Antarctic sea ice extent is actually reaching a record minimum, that’s definitely of interest.”
Meier said it is too early to tell if this year marks a shift in the behavior of Antarctic sea ice.
“It is tempting to say that the record low we are seeing this year is global warming finally catching up with Antarctica,” Meier said. “However, this might just be an extreme case of pushing the envelope of year-to-year variability. We’ll need to have several more years of data to be able to say there has been a significant change in the trend.”
Read more:
Data visualization: Minimum Antarctic Sea Ice 2017
The Watchers team and our contributors bring the latest on extreme weather, earthquakes, volcanic eruptions, space weather, and all things science. We're all about making sense of the natural world and keeping you informed on what’s happening. Got a tip or a question? Hit us up using the form at newstips!
Commenting rules and guidelines
We value the thoughts and opinions of our readers and welcome healthy discussions on our website. In order to maintain a respectful and positive community, we ask that all commenters follow these rules.