
Satellite-assisted models for detection of desert locust breeding grounds
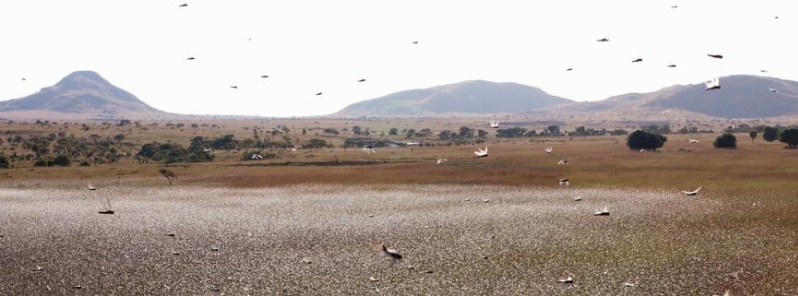
Image credit: FAO Emergencies
NASA-funded researchers examined satellite-based soil moisture and soil composition in the hope to predict optimal breeding sites of locust swarms. The team is now working to integrate the data into the FAO locust support to be better prepared for the next major locust invasion.
In 2020, eastern Africa saw its worst plague in decades. As of present, locust swarms still persist in some locations, especially in Ethiopia and Kenya. As the outbreaks spread, NASA-funded researchers worked to better forecast the swarms. In a new study, the team showed that by examining soil moisture and composition, they could forecast optimal breeding sites 85 percent of the time.
"We looked at soil moisture and texture because those are critical components to the locust life cycle. We are essentially identifying where the locusts are breeding," said author Lee Ellenburg, the food security and agriculture lead for NASA’s SERVIR program.
The most effective time to eliminate desert locusts is during the egg and hopper phase, a period when the insects are still developing wings. In two to four months, the locusts mature and form wings, which makes it difficult to terminate them.
"Knowing the life cycle of the locust and the temperatures in the region, we can backtrack and estimate when those locusts were hatching and what the soil conditions were," Ellenburg explained. "We found that we can detect the optimal breeding conditions and accurately predict where the swarms will appear up to nine weeks ahead of time."
A map published by NASA show various soil moisture and texture conditions, the major features of potential breeding sites, before outbreaks occurred in eastern Africa in 2020. The darkest shade indicates optimal soil moisture and textures for breeding, while the lightest shade shows areas with poor breeding conditions.
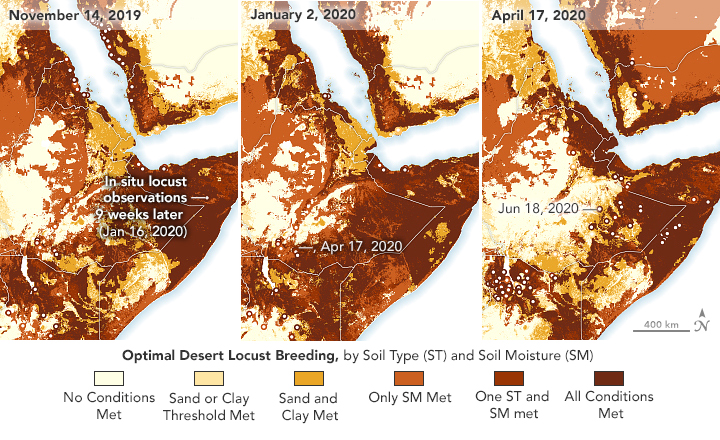
Image credit: NASA Aqua/MODIS, Terra/MODIS
During the outbreaks, the research team shared soil condition products with FAO and PlantVillage, which made a crowdsourcing application to allow trained citizens and government personnel to catalog locust sightings. PlantVillage used the soil moisture data to help prioritize sites for surveying.
The team is now working to incorporate their soil condition products into the FAO locust support dashboard, which also has other relevant factors such as wind patterns, temperatures, and vegetation. Their goal is to be better prepared for the next major locust invasion.
"If this were to happen again in two years, we don’t want to be scrambling for information. These satellite datasets and ground information help us with tracking, understanding, and providing necessary early warnings about how bad conditions may get," said Catherine Nakalembe, a food security researcher with SERVIR and NASA Harvest.
Reference
"Detecting Desert Locust Breeding Grounds: A Satellite-Assisted Modeling Approach" – Ellenburg, W. L., et al. – Remote Sensing – https://doi.org/10.3390/rs13071276 – OPEN ACCESS
Abstract
The objective of this study is to evaluate the ability of soil physical characteristics (i.e., texture and moisture conditions) to better understand the breeding conditions of desert locust (DL). Though soil moisture and texture are well-known and necessary environmental conditions for DL breeding, in this study, we highlight the ability of model-derived soil moisture estimates to contribute towards broader desert locust monitoring activities. We focus on the recent DL upsurge in East Africa from October 2019 though June 2020, utilizing known locust observations from the United Nations Food and Agriculture Organization (FAO). We compare this information to results from the current literature and combine the two datasets to create “optimal thresholds” of breeding conditions. When considering the most optimal conditions (all thresholds met), the soil texture combined with modeled soil moisture content predicted the estimated DL egg-laying period 62.5% of the time. Accounting for the data errors and uncertainties, a 3 × 3 pixel buffer increased this to 85.2%. By including soil moisture, the areas of optimal egg laying conditions decreased from 33% to less than 20% on average.
Commenting rules and guidelines
We value the thoughts and opinions of our readers and welcome healthy discussions on our website. In order to maintain a respectful and positive community, we ask that all commenters follow these rules.