
2015/16 strong El Niño declines, but continues to influence the global climate
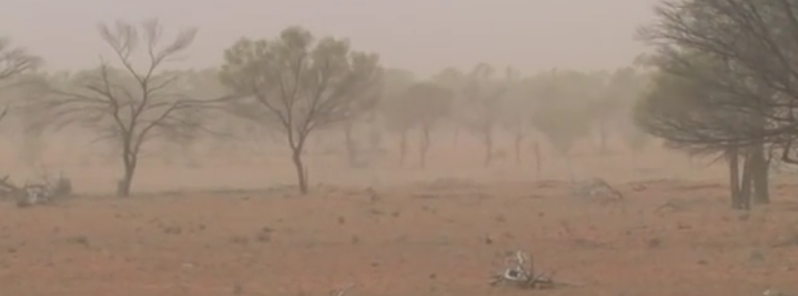
Featured image: El Niño associated droughts. Image credit: BOM
The 2015/16 El Niño has passed its peak and continues to decline gradually, according to the latest updates from the World Meteorological Organization (WHO) and Australian Bureau of Meteorology (BOM). Despite the weakening trend, it will continue to influence the global climate before it fades away during the second quarter of 2016.
Sea surface temperatures (SST) in the tropical Pacific Ocean are cooling, and colder than average water masses beneath the surface are advancing into the eastern Pacific. SSTs in the eastern and central tropical Pacific Ocean were over 2 °C above average during late 2015.
Trade winds for the 5 days ending February 14 are mostly close to normal across the equatorial Pacific Ocean. There is little change in the pattern from a fortnight ago. The return to near-normal trade winds is consistent with a declining El Niño. Prior to January 2016, trade winds had been consistently weaker than average, and on occasion reversed in direction (i.e. westerly rather than easterly), since the start of 2015. Image credit: BOM/TAO Project Office/PMEL/NOAA
The current episode is one of the strongest on record, comparable with the 1997/98 and 1982/83 phenomena. However, it cannot be corroborated yet that this year's event is the strongest on record.
SSTs peaked during November and December 2015 and declined by about half a degree since.
Video credit: WMO
"We have just witnessed one of the most powerful ever El Niño events which caused extreme weather in countries on all continents and helped fuel record global heat in 2015. In meteorological terms, this El Niño is now in decline. But we cannot lower our guard as it is still quite strong and in humanitarian and economic terms, its impacts will continue for many months to come," said WMO Secretary General Petteri Taalas.
"Parts of South America and East Africa are still recovering from torrential rains and flooding. The economic and human toll from drought – which by its nature is a slowly developing disaster – is becoming increasingly apparent in southern and the Horn of Africa, central America and a number of other regions," he said.
"The world was better prepared for this event than ever before. Scientific research conducted during this event will enhance our understanding of El Niño and the inter-linkages between this naturally occurring climate phenomenon and human-induced climate change. Lessons learnt from this El Niño will be used to further build our resilience to weather-related hazards, which will increase as a result of climate change."
The SST (sea surface temperature) anomaly map for January 2016 shows warm SST anomalies extending across almost the entire equatorial Pacific. The warm anomalies show a slight decrease along the equator and in the northeast of the Basin and an increase near the coast of South Africa since December 2015. Warm anomalies persist over much of the Indian Ocean.
.gif)
Monthly SST anomaly map for January 2016. Baseline period 1961-1990. Image credit: BOM
.png)
Image credit: BOM
In January, the NINO3 index in the eastern Pacific cooled, declining from its peak value which had remained steady during November and December. The NINO3.4 and NINO4 indices also cooled during January. Values in the Bureau dataset for NINO3, NINO3.4, and NINO4 were +2.1 °C, +2.2 °C and +1.3 °C respectively, indicative of a strong El Niño event.
.gif)
The four-month sequence of sub-surface temperature anomalies (to January) shows a decrease in warm sub-surface temperature anomalies compared to December, while the area of cool sub-surface anomalies has strengthened and contracted. Image credit: BOM
According to WMO, it is still too early to predict whether there will be a swing to La Nina after El Nino declines. The joint WMO-WHO Climate and Health Office are coordinating efforts to manage the health risks and responses in vulnerable countries.
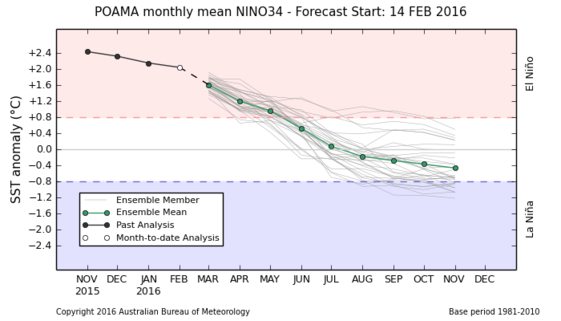
All eight international climate models surveyed by the Bureau indicate central Pacific sea surface temperatures (SSTs) will continue to cool in the coming months. Two models indicate central Pacific SSTs will fall below El Niño thresholds by May and the other six by July, 2016. Image credit: BOM
The 2015/16 El Nino major impacts
In the global outlook, 2015 was the hottest year on record by a wide margin. The global average surface temperature was 0.76 ± 0.1 °C above the 1961-1990 average. For the first time on record, temperatures in 2015 were about 1°C above the pre-industrial era, according to a consolidated analysis of the World Meteorological Organization (WMO).
Regional impacts
Eastern Africa
El Niño is usually associated with enhanced rainfall in countries including Kenya and Uganda within the equatorial sector of the Greater Horn of Africa during the October – December short rainy season. However, local systems and the sea surface temperature patterns in the Indian Ocean are also important. In Ethiopia, 2015 spring rains failed, and El Niño affected rainfall patterns for the 2015 summer rains leading to serious food insecurity in affected areas.
Southern Africa
Below average rainfall was reported in a number of countries, including Lesotho, Malawi, Mozambique, South Africa, Swaziland, Zambia and Zimbabwe. The World Food Programme estimates that more than 40 million people could become food insecure.
South Asia
Southwest monsoon: The India Meteorological Department reported that the June-September rainfall over India as a whole was 86% of its long period average. El Niño is believed to have played a key role in the rainfall deficit. Conversely, it was linked to higher than normal rainfall in southern India and Sri Lanka during winter.
Video credit: NCAR Vislab
South East Asia
El Niño is typically associated with drought in southern parts of South East Asia during the July to October period. This helped to fuel wildfires in Indonesia, among the worst on record, which caused a dense haze to cover many parts of Indonesia and other neighboring countries, with significant repercussions for health. During the northeast monsoon season (December to early March) the impact of El Niño is less significant.
Pacific Islands
Historically, El Niño has caused reduced rainfall in the southwest Pacific (from southern Papua New Guinea southeast to the southern Cook Islands) and enhanced rainfall in the central and eastern Pacific (e.g. Tuvalu, Kiribati, Tokelau and Nauru). But it also affects the number of tropical cyclones and their preferred tracks, so that there is a risk of extreme rainfall events even where drier than normal conditions are forecast.
Australia
El Niño contributed to a drier and warmer year in 2015.
Video credit: BOM
South America
El Niño has a major impact on a number of countries in South America and was linked to severe flooding in Paraguay in December. In its latest outlook, the International Center for the Investigation of El Niño (CIIFEN), predicted a high probability of above average rainfall in February-March-April in Mexico, northern Peru, coastal Ecuador, central and eastern Paraguay, southeastern Brazil, Uruguay and northern Argentina. It said there was a significant likelihood of below average rainfall in Costa Rica, Panama, northern Venezuela, northern Colombia, northeastern and eastern Brazil and northern Chile.
Central America
El Niño was associated with serious droughts in Guatemala, Honduras, and El Salvador. Some Caribbean countries have also suffered drought.
North America
El Niño affected temperature and precipitation patterns in the United States and Canada, and this is expected to continue for the coming months. The U.S. seasonal outlooks for February – April indicate an increased likelihood of above-average precipitation across the southern tier of the United States and below-average precipitation over the northern tier. Above-average temperatures are favored in the North and West, and below-average temperatures are favored in the southern Plains and along the Gulf Coast.
Weather pattern and environmental impact
Coral bleaching
Record ocean temperatures, caused in part by El Niño, have contributed to a major coral bleaching event. It began in the north Pacific in summer 2014 and expanded to the south Pacific and Indian oceans in 2015. It is hitting U.S. coral reefs disproportionately hard. NOAA estimates that by the end of 2015, almost 95 percent of U.S. coral reefs will have been exposed to ocean conditions that can cause corals to bleach.
NOAA Coral Reef Watch's most recent Coral Bleaching Alert Area. This figure shows the regions currently experiencing high levels of thermal stress that cause coral bleaching. Image credit: NOAA
.gif) NOAA Coral Reef Watch's most recent Four-Month Coral Bleaching Thermal Stress Outlook is below. This figure shows the distribution of the lowest thermal stress levels predicted by at least 60% of the model ensemble members. In other words, there is a 60% chance that the displayed thermal stress levels will occur. Image credit: NOAA
NOAA Coral Reef Watch's most recent Four-Month Coral Bleaching Thermal Stress Outlook is below. This figure shows the distribution of the lowest thermal stress levels predicted by at least 60% of the model ensemble members. In other words, there is a 60% chance that the displayed thermal stress levels will occur. Image credit: NOAA
Tropical cyclones
El Niño contributed to a very active tropical cyclone season in the Western North Pacific and Eastern North Pacific basins. Hurricane Patricia, which made landfall in Mexico on 24 October 2015, was reportedly the most intense tropical cyclone in the western hemisphere. It reduced hurricane activity in the Atlantic and around Australia.
Low Solar Activity, Increasing Cosmic Rays from Decreasing Magnetosphere, causing lower Cloud Formation on Earth. Causing Atmosphere Compression Events, ushering in Wild Weather Swings. So when you hear on the news about 500 year floods, and record one day snow fall at Italy, were entering in a little/mini ice age! El Nino, will be flowed by a strong La Nina. Why are we not being warned! Russia and Pakastan have warned there people.