
NOAA: State of the Climate in 2015
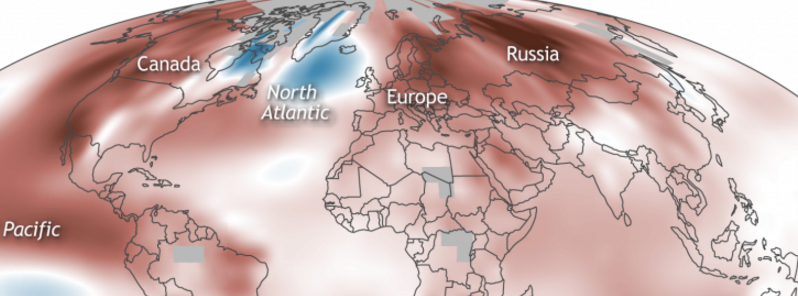
Featured image: The average temperature departures for 2015 in comparison to the average values in the period between 1981 and 2010. Image credit: NOAA
The year 2015 is now officially the warmest year since the mid-to-late 19th century, according to a newly released annual State of the Climate report, compiled by NOAA’s Center for Weather and Climate. The record-breaking heat is likely the result of a combination of long-term global warming, and one of the strongest El Niño events since 1950.
Several important climate parameters toppled the records in 2015. Temperatures were 1.0 °C (1.8 °F) higher than in the pre-industrial era, and carbon dioxide, methane and nitrous oxide greenhouse gases also reported record high values. The average carbon dioxide global concentration was 399.4 ppm, which is for 2.2 ppm higher than observed in 2014. The Mauna Loa observatory reported its first annual mean carbon dioxide concentration above 400 ppm.
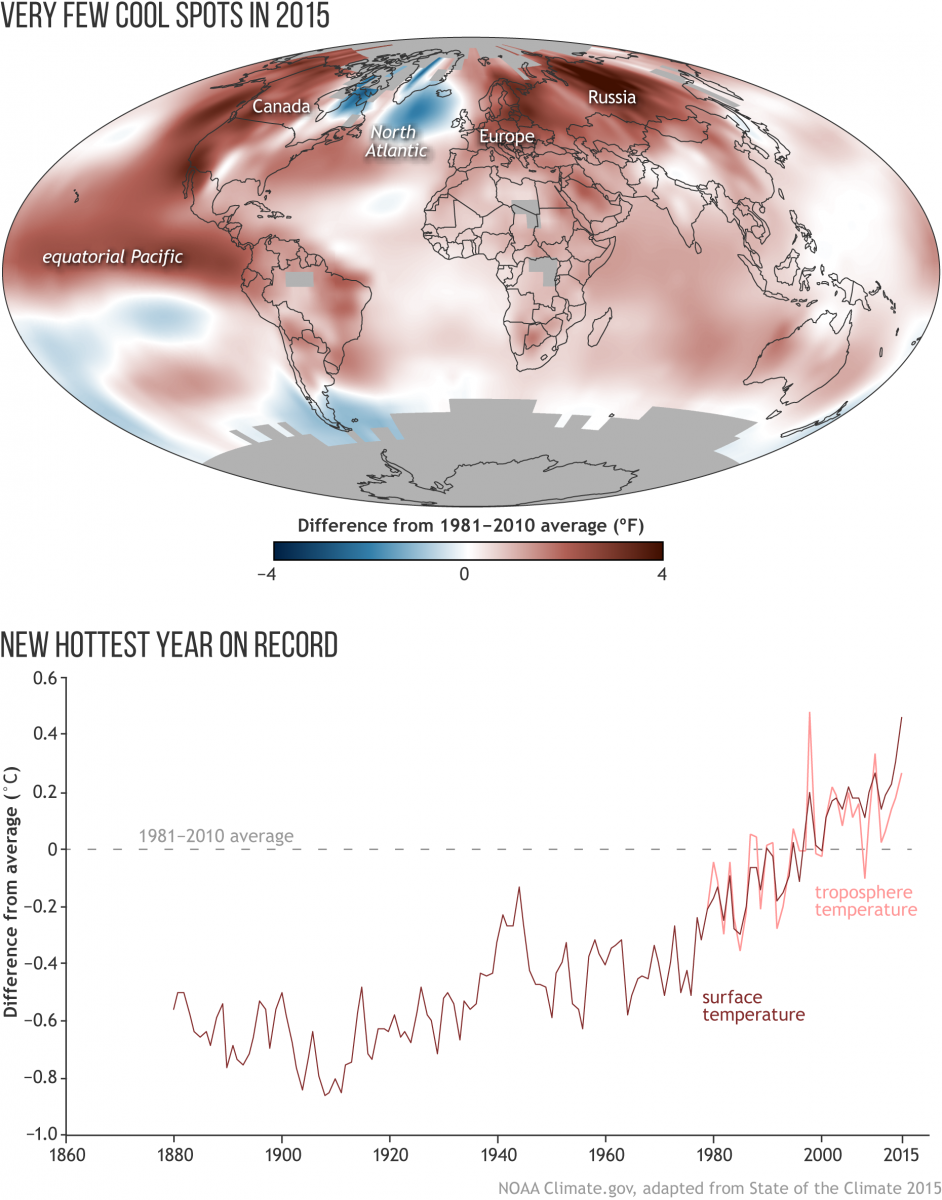
The top image shows the average temperature departures for 2015 in comparison to the average values in the period between 1981 and 2010. The bottom image shows temperature in the period between 1880 and 2015 in comparison to the average values from the 1981-2010 period. Image credit: NOAA Climate.gov
The sea surface temperature also toppled existing records. When globally averaged, the values were between 0.33 and 0.39 °C (0.59 and 0.7 °F) above the mean, also surpassing the 2014 record. The global upper ocean heat content was also highest on record, due to continuing heat accumulation in its top layers.
A new record was also reported for the global sea level rise, as it increased for about 70 mm (2.75 inches) when compared to levels measured by satellite in 1993.
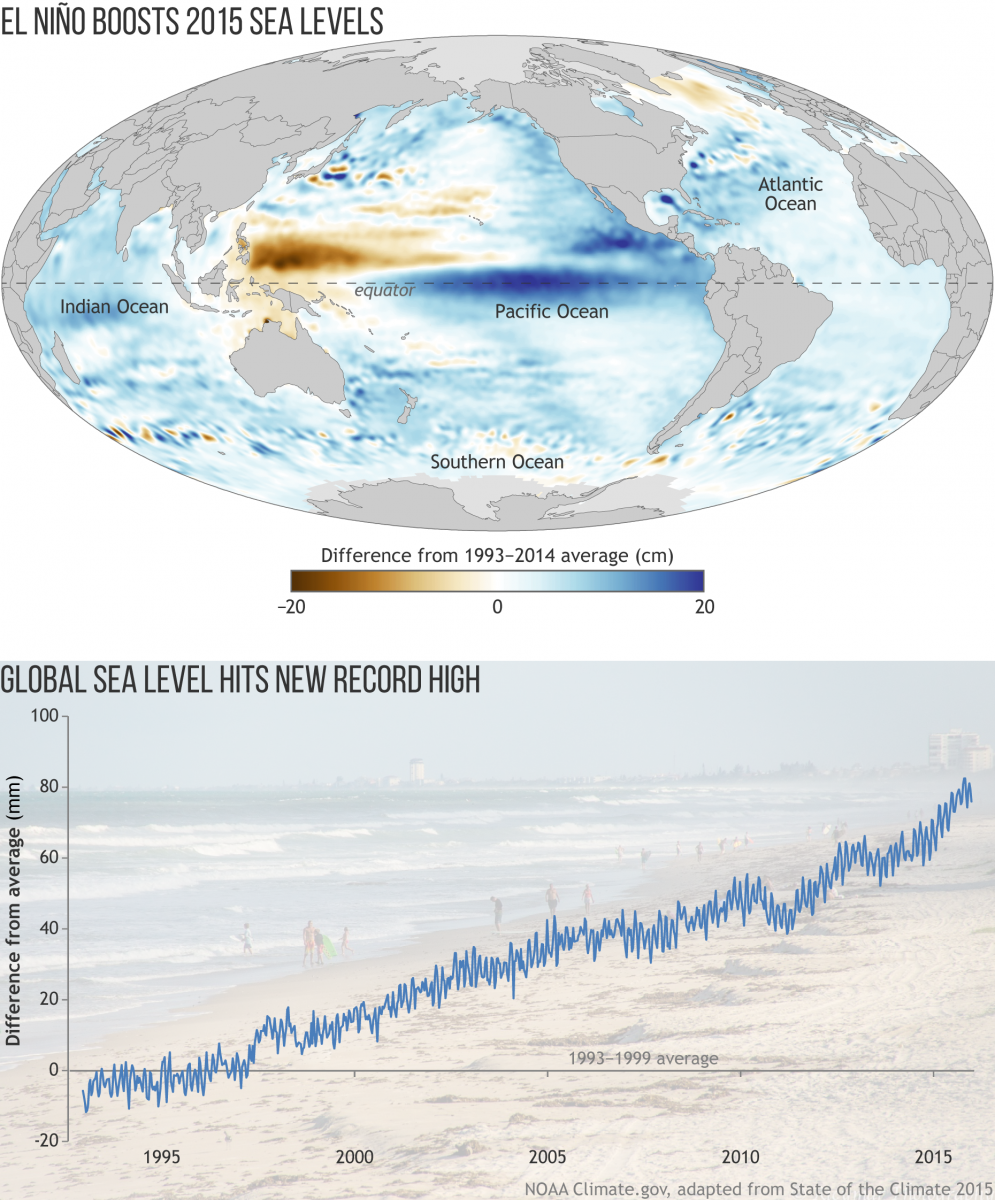
The map reveals sea level in 2015 in comparison to 1993-2014 average. The graph below shows yearly global sea level since 1993 in comparison to the 1993-1999 average line. Image credit: NOAA Climate.gov. Photo by Roberto Mangual – Creative Commons license.
Tropical cyclones were also more active than on average, according to the report. In total, 101 tropical cyclones were observed across the global oceans, which is significantly above the average 82 such systems reported in the period between 1981 and 2010. 26 named storms were reported in the eastern and central Pacific basin, the highest number since 1992 while in the North Atlantic fewer tropical systems than over the last 20 years were observed.
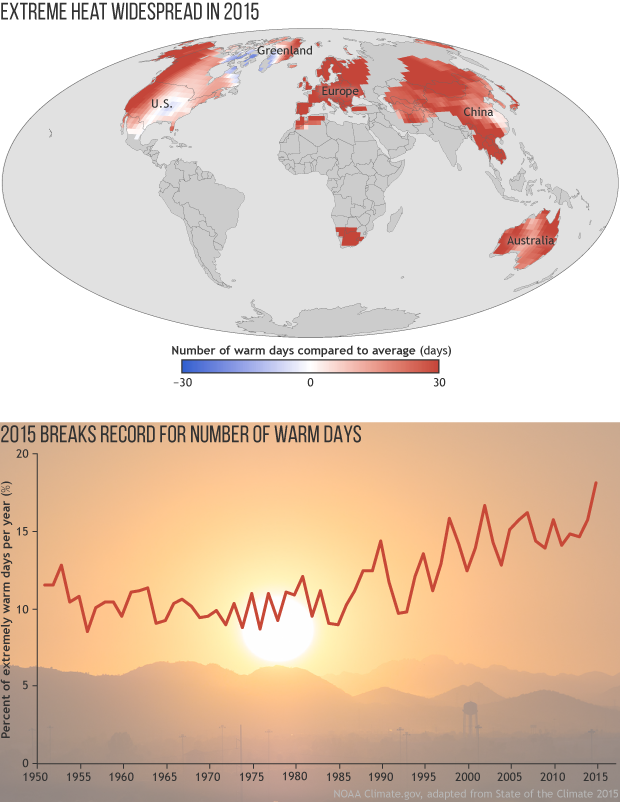
The map shows the frequency of warm days in 2015 in comparison to the 1961-1990 average. The graph shows the percent of extremely warm days each year in the period between 1950 and 2015. Image credit: NOAA Climate.gov. Photo: Bob James via Creative Commons license
The Arctic sea extent retained low levels, as the region continued to warm up. The land surface temperature was 1.2 °C (2.2 °F) above the average value recorded in the period between 1981 and 2012, thus tying with the records set in 2007 and 2011. The maximum sea ice extent observed in February 2015 was the lowest in 37 years, and the minimum sea ice extent in September was the fourth lowest ever recorded.
Find the full report, here.
Commenting rules and guidelines
We value the thoughts and opinions of our readers and welcome healthy discussions on our website. In order to maintain a respectful and positive community, we ask that all commenters follow these rules.