
Tropical Storm “Halong” rapidly intesified to Category 4 typhoon, Northwestern Pacific
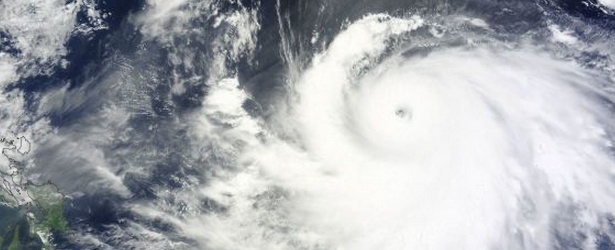
Featured image: Typhoon "Halong" captured on August 2, 2014. Image credit: NASA Terra/MODIS
Tropical Storm "Halong" rapidly intensified over the last 24 hours and became Category 4 typhoon. The storm formed late July 2014 in the open waters of the Northwestern Pacific, strengthened and continued on its track through the Marianas Islands. The system is expected to continue intensifying for the next two days before it begins a weakening trend. It is expected to pass near Okinawa sometime on August 6 as Category 3 typhoon.
Halong's maximum sustained winds at 06:00 UTC today were 115 knots (132 mph, 212 km/h), wind gusts were 140 knots (161 mph, 259 km/h). Maximum significant wave height was 33 feet (10 meters).
According to JTWC warning issued 09:00 UTC today, Typhoon "Halong" was located approximately 825 nautical miles (949 miles, 1 527 km) southeast of Kadena Air Force Base, and has tracked westward at 07 knots (8.0 mph/12.9 km/h) over the past six hours.
According to the warning issued at 12:15 UTC today by PAGASA, Typhoon "Halong" entered Philippine Area of Responsibility (PAR) and was named "Jose". PAGASA said Typhoon "Jose" will not yet affect any part of the country. However, the Southwest Monsoon will bring occasional rains over Metro Manila, Central Luzon, Ilocos Region, CALABARZON and MIMAROPA.
JTWC expects "Halong" to reach maximum sustained winds of 130 knots (149 mph, 240 km/h), and wind gusts of 160 knots (184 mph, 297 km/h) by 06:00 UTC on August 3.
Typhoon "Halong" forecast track by JTWC on August 2, 2014.

Typhoon "Halong" captured on August 2, 2014. Image credit: NASA Aqua/MODIS
When Aqua satellite passed over "Halong" on July 29 at 03:29 UTC the infrared data showed very cold, high thunderstorm cloud top temperatures of powerful storms surrounding the center, with what appears to be an eye developing. Microwave satellite data also showed a small eye, with tightly-curved bands of thunderstorms wrapping into it.
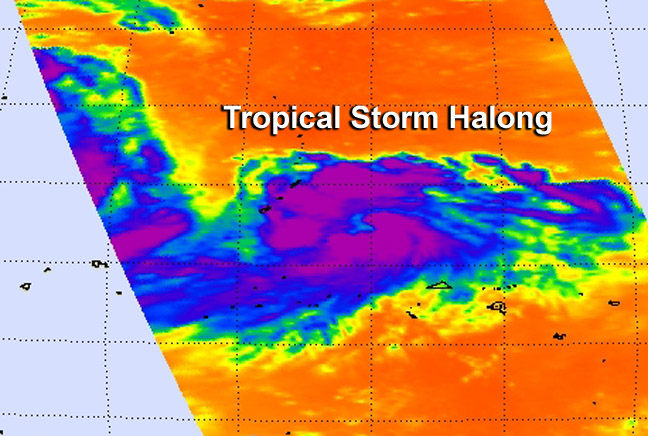
NASA's Aqua satellite passed over Tropical Storm Halong on July 29 at 03:29 UTC infrared data showed very cold thunderstorm cloud top temperatures of surrounding the center and developing eye. Image credit: NASA JPL
At 15:00 UTC, on July 29, Tropical Storm Halong's maximum sustained winds were near 55 knots (63.2 mph/101.9 km/h). Halong was centered near 13.7 north latitude, approximately 134 nautical miles (154 miles/248 km) east of Andersen Air Force Base. Halong has tracked northwestward at 11 knots (12.6 mph/20.3 kph) through the Marianas Islands while continuing to intensify.
By July 30, there were two tropical low pressure areas in the Northwestern Pacific Ocean and they were close enough to each other to be captured in one image generated from data gathered by NASA's Aqua satellite. Tropical Storm Warning was in effect for Guam and a Typhoon Warning was issued for Rota.
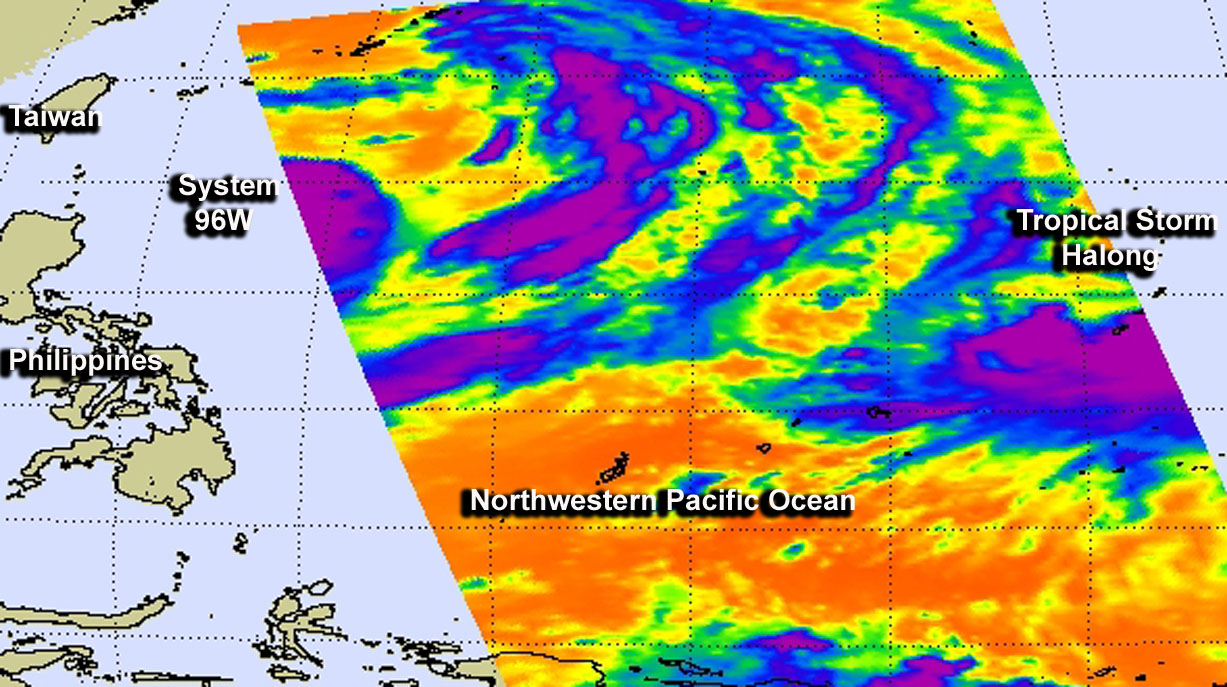
NASA's Aqua satellite flew over both developing System 96W (left) and Tropical Storm Halong (right) on July 30 and had powerful thunderstorms with cloud top temperatures as cold as -63F/-52C. Image credit: NASA JPL, Ed Olsen
NASA's Aqua satellite flew over both Tropical Storm Halong and developing System 96W early on July 30 and the Atmospheric Infrared Sounder (AIRS) instrument captured infrared data on them in one image. Both systems showed powerful thunderstorms stretching high into the troposphere with cloud top temperatures as cold as -63F/-52C. Those thunderstorms have the potential for heavy rainfall.
The center of the storm, at the time, was about 75 nautical miles (86.3 miles/138.9 km) northwest of Navsta, Guam, near 14.4 north latitude and 143.4 east longitude. Halong's maximum sustained winds were near 50 knots (57.4 mph/92.6 kph). The JTWC expected Halong to strengthen to typhoon status by August 1. Halong was moving to the west at 8 knots (9.2 mph/14.8 kph).
System 96W was located near 19.9 north latitude and 130.5 east longitude, about 416 nautical miles south-southeast of Kadena Air Base, Okinawa, Japan. The JTWC described System 96W as a monsoon depression with improved deep convection begins to consolidate as a typical tropical cyclone. Maximum sustained surface winds are estimated between 20 to 25 knots (23.0 to 28.7 mph / 37.0 to 46.3 km/h). Minimum sea level pressure was estimated to be near 996 millibars.
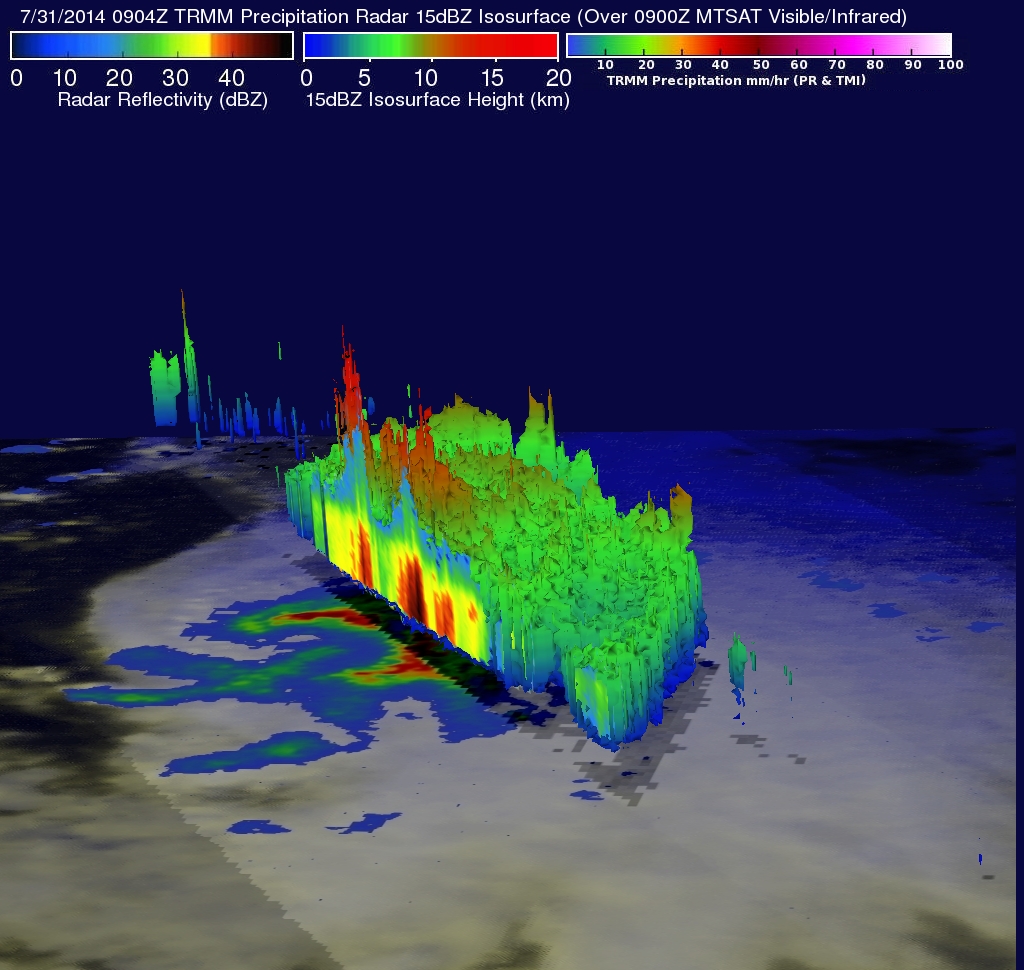
On July 31, NASA's TRMM Satellite showed rain was falling at a rate of over 85.6 mm (about 3.4 inches) per hour in bands wrapping around Halong's southeastern side. Credit: NASA/SSAI, Hal Pierce
NASA's Tropical Rainfall Measuring Mission or TRMM Satellite passed over Guam as heavy rain fell over the island while Tropical Storm Halong's center passed just to the north of the island, at 09:04 UTC on July 31.
TRMM's Precipitation Radar revealed that rain was falling at a rate of over 85.6 mm (about 3.4 inches) per hour in bands wrapping around Halong's southeastern side.
A simulated 3-D view of Halong (from the northwest) was produced at NASA Goddard using radar reflectivity data from TRMM's Precipitation Radar instrument. The image showed a slice near the southern edge of the tropical storm's center found thunderstorms reaching heights of over 16.7 km (about 10.4 miles). The release of energy within these intense thunderstorm towers often portends a tropical cyclone's intensification.
On August 1 at 13:30 UTC the Moderate Resolution Imaging Spectroradiometer or MODIS instrument aboard NASA's Terra satellite captured an infrared picture of the intensifying system. The infrared data showed the coldest, strongest thunderstorm cloud-top temperatures east of the center of circulation. Cloud tops were as cold as -80F/-62C. Cloud top temperatures that cold indicate thunderstorm cloud tops are near the top of the troposphere, and have the potential to drop very heavy rainfall.
At 15:00 UTC Tropical Storm Halong had maximum sustained winds near 60 knots (69.0 mph/111.1 kph). It was centered near 14.9 north latitude and 137.9 east longitude, about 324 nautical miles (600 miles/372.9 km) north of Yap. It was moving to the west-northwest at 7 knots (8.0 mph/12.9 km/h).
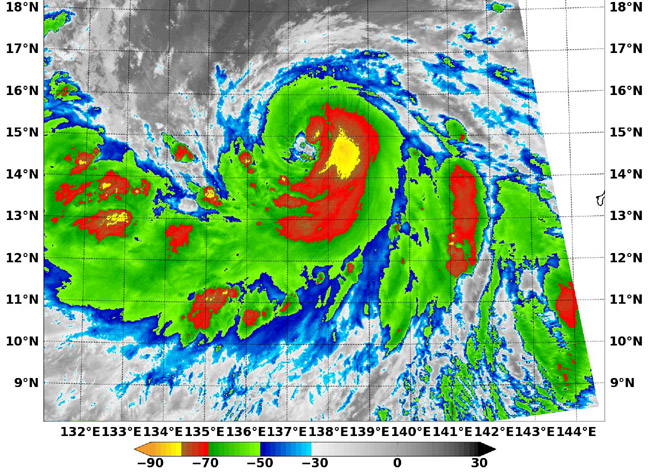
On August 1 at 9:30 a.m. ED, NASA's Terra satellite captured this infrared picture of Tropical Storm Halong. Strongest storms and coldest cloud tops as cold as -80F/-62C (yellow) east of the center. Image credit: NASA/NRL
I'm a dedicated researcher, journalist, and editor at The Watchers. With over 20 years of experience in the media industry, I specialize in hard science news, focusing on extreme weather, seismic and volcanic activity, space weather, and astronomy, including near-Earth objects and planetary defense strategies. You can reach me at teo /at/ watchers.news.
Commenting rules and guidelines
We value the thoughts and opinions of our readers and welcome healthy discussions on our website. In order to maintain a respectful and positive community, we ask that all commenters follow these rules.