
15 percent of United States gripped by extreme to exceptional drought
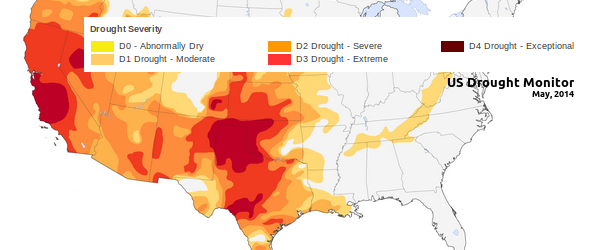
Image credit: U.S. Drought Monitor
As of May 6, 2014, nearly 15 percent of United States was gripped by extreme to exceptional drought, according to U.S. Drought Monitor. Half of the United States was experiencing at least some level of drought.
The summer season is just beginning but dry conditions are already making a serious impact on fruit and vegetable agriculture in California. News reports sounded the alarm for grains and livestock in the Plains and South Central West. At least 54 percent of the nation’s wheat crop is affected by some level of drought, as is 30 percent of corn, and 48 percent of cattle. (EO)
Snowpack is 50 percent of normal in many locations in the West, and Mark Svoboda of the National Drought Mitigation Center noted that a lot of snow has completely melted before it normally would.
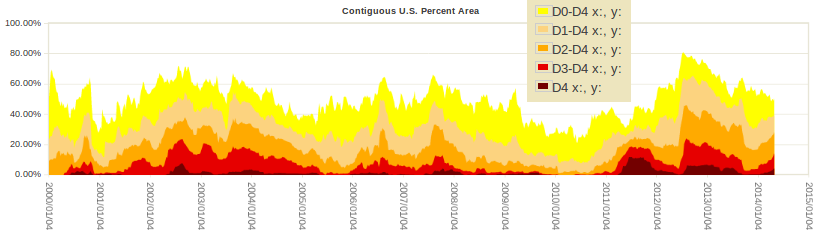
Compared to any other first half of May data for contiguous U.S. since 2000, this year is showing good potential to remain remembered as another record breaker.
If you are into statistics check the table below containing only May data since 2000.
Percent area in U.S. Drought Monitor categories (2000 – 2014)
(contiguous U.S.)
Source: U.S. Drought Monitor – Maps and Data
| Week | Nothing | D0 – Abnormally Dry | D1 – Moderate | D2 – Severe | D3 – Extreme | D4 – Exceptional |
|---|---|---|---|---|---|---|
| 5/6/2014 | 49.33 | 10.61 | 11.72 | 13.85 | 10.04 | 4.45 |
| 5/28/2013 | 43.13 | 12.53 | 14.78 | 17.82 | 7.00 | 4.74 |
| 5/21/2013 | 39.06 | 14.87 | 14.92 | 18.52 | 7.70 | 4.94 |
| 5/14/2013 | 38.27 | 14.07 | 15.36 | 18.66 | 9.24 | 4.40 |
| 5/7/2013 | 37.58 | 14.36 | 15.18 | 18.76 | 9.74 | 4.38 |
| 5/29/2012 | 35.98 | 26.65 | 18.43 | 13.72 | 4.57 | 0.66 |
| 5/22/2012 | 37.68 | 27.02 | 15.84 | 13.51 | 4.99 | 0.95 |
| 5/15/2012 | 45.21 | 21.15 | 15.25 | 12.68 | 4.69 | 1.02 |
| 5/8/2012 | 43.88 | 20.24 | 16.23 | 12.87 | 5.17 | 1.61 |
| 5/1/2012 | 40.67 | 21.15 | 17.77 | 13.48 | 5.00 | 1.93 |
| 5/31/2011 | 68.95 | 5.49 | 4.87 | 6.01 | 8.43 | 6.25 |
| 5/24/2011 | 68.67 | 5.86 | 5.21 | 6.80 | 7.84 | 5.62 |
| 5/17/2011 | 67.69 | 5.96 | 5.67 | 7.51 | 7.14 | 6.04 |
| 5/10/2011 | 66.19 | 7.38 | 5.89 | 8.05 | 6.54 | 5.94 |
| 5/3/2011 | 66.22 | 7.38 | 7.14 | 7.60 | 8.54 | 3.12 |
| 5/25/2010 | 76.25 | 14.48 | 6.79 | 2.30 | 0.18 | 0.00 |
| 5/18/2010 | 74.13 | 15.54 | 7.59 | 2.71 | 0.03 | 0.00 |
| 5/11/2010 | 69.22 | 19.44 | 8.73 | 2.62 | 0.00 | 0.00 |
| 5/4/2010 | 68.58 | 20.56 | 8.25 | 2.62 | 0.00 | 0.00 |
| 5/26/2009 | 69.37 | 16.12 | 8.84 | 4.14 | 0.94 | 0.59 |
| 5/19/2009 | 66.28 | 16.62 | 9.90 | 5.31 | 1.15 | 0.75 |
| 5/12/2009 | 65.12 | 17.76 | 9.62 | 4.85 | 1.33 | 1.31 |
| 5/5/2009 | 60.91 | 21.84 | 9.87 | 5.26 | 1.26 | 0.86 |
| 5/27/2008 | 60.00 | 18.47 | 13.41 | 6.48 | 1.64 | 0.00 |
| 5/20/2008 | 54.30 | 20.51 | 16.55 | 7.09 | 1.55 | 0.00 |
| 5/13/2008 | 53.83 | 21.62 | 15.94 | 6.53 | 2.09 | 0.00 |
| 5/6/2008 | 52.60 | 21.79 | 16.87 | 6.54 | 2.20 | 0.00 |
| 5/29/2007 | 49.49 | 16.67 | 16.17 | 10.78 | 6.89 | 0.00 |
| 5/22/2007 | 50.97 | 15.23 | 16.42 | 10.73 | 6.65 | 0.00 |
| 5/15/2007 | 51.23 | 15.92 | 16.84 | 10.52 | 5.49 | 0.00 |
| 5/8/2007 | 53.45 | 14.94 | 17.04 | 9.46 | 5.12 | 0.00 |
| 5/1/2007 | 52.44 | 15.05 | 17.64 | 10.15 | 4.73 | 0.00 |
| 5/30/2006 | 50.64 | 19.98 | 14.50 | 8.00 | 5.59 | 1.29 |
| 5/23/2006 | 54.59 | 18.24 | 13.26 | 6.79 | 5.77 | 1.36 |
| 5/16/2006 | 53.39 | 21.55 | 12.08 | 6.14 | 5.48 | 1.36 |
| 5/9/2006 | 48.36 | 25.56 | 13.66 | 5.46 | 5.26 | 1.70 |
| 5/2/2006 | 49.16 | 20.82 | 14.55 | 9.91 | 3.74 | 1.82 |
| 5/31/2005 | 54.96 | 21.34 | 13.14 | 8.67 | 1.89 | 0.00 |
| 5/24/2005 | 55.47 | 22.27 | 11.58 | 8.78 | 1.89 | 0.00 |
| 5/17/2005 | 59.88 | 18.78 | 10.91 | 8.54 | 1.89 | 0.00 |
| 5/10/2005 | 52.61 | 24.88 | 9.26 | 9.96 | 3.29 | 0.00 |
| 5/3/2005 | 55.76 | 22.46 | 8.60 | 8.55 | 3.97 | 0.67 |
| 5/25/2004 | 42.32 | 17.75 | 14.04 | 12.97 | 12.11 | 0.81 |
| 5/18/2004 | 46.40 | 16.28 | 11.88 | 13.29 | 11.04 | 1.11 |
| 5/11/2004 | 45.17 | 15.72 | 12.15 | 14.62 | 11.26 | 1.09 |
| 5/4/2004 | 45.83 | 14.48 | 12.98 | 14.69 | 10.95 | 1.08 |
| 5/27/2003 | 46.92 | 11.11 | 17.39 | 14.34 | 9.64 | 0.60 |
| 5/20/2003 | 45.98 | 11.36 | 17.18 | 15.34 | 9.55 | 0.60 |
| 5/13/2003 | 43.78 | 14.31 | 20.68 | 10.85 | 9.76 | 0.62 |
| 5/6/2003 | 38.67 | 18.53 | 19.35 | 12.57 | 10.61 | 0.26 |
| 5/28/2002 | 37.91 | 17.56 | 13.61 | 13.30 | 14.89 | 2.73 |
| 5/21/2002 | 40.43 | 15.23 | 13.94 | 13.53 | 16.26 | 0.61 |
| 5/14/2002 | 38.56 | 14.68 | 15.42 | 14.90 | 15.79 | 0.65 |
| 5/7/2002 | 36.39 | 19.65 | 12.29 | 20.28 | 10.79 | 0.61 |
| 5/29/2001 | 55.13 | 14.73 | 16.60 | 11.09 | 1.97 | 0.49 |
| 5/22/2001 | 53.75 | 14.34 | 18.58 | 10.76 | 2.08 | 0.49 |
| 5/15/2001 | 51.44 | 16.69 | 16.57 | 12.50 | 2.34 | 0.46 |
| 5/8/2001 | 52.51 | 18.97 | 15.34 | 11.20 | 1.71 | 0.27 |
| 5/1/2001 | 63.07 | 11.99 | 14.51 | 8.90 | 1.27 | 0.27 |
| 5/30/2000 | 62.05 | 13.77 | 10.48 | 8.61 | 4.82 | 0.26 |
| 5/23/2000 | 57.84 | 18.39 | 9.66 | 10.54 | 3.59 | 0.00 |
| 5/16/2000 | 52.57 | 19.09 | 12.81 | 12.55 | 2.99 | 0.00 |
| 5/9/2000 | 55.75 | 19.56 | 11.86 | 11.18 | 1.66 | 0.00 |
| 5/2/2000 | 55.43 | 18.88 | 12.46 | 11.56 | 1.66 | 0.00 |
Data source: U.S. Drought Monitor
Commenting rules and guidelines
We value the thoughts and opinions of our readers and welcome healthy discussions on our website. In order to maintain a respectful and positive community, we ask that all commenters follow these rules.