
Ups and downs in the daily minimum solar irradiance
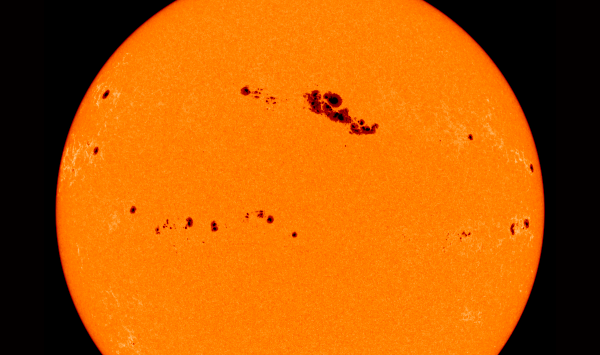
Image credit: HMI Intensitygram showing sunspots on March 29, 2001 (Courtesy of NASA/SDO and the AIA, EVE, and HMI science teams)
With quite regular intervals of about 27 days which Sun takes to make full rotation circle, the Sun alternates between an active hemisphere with relatively many sunspots , and a hemispheric “face” that is pretty much void of these dark blemishes. For as long as it lasts, this is quite a helpful tool for the medium term space weather forecasting. The last 6 months, both PROBA2/Lyra (in UV and X-ray) and GOES15/XRS (in X-ray) have been monitoring almost periodic ups and downs in the daily minimum solar irradiance.
 Long-term solar irradiance levels (LYRA/GOES)
A movie was developed showing the Sun’s outlook in white light (sunspots) and in EUV (corona) in response to the cyclic behavior of the measured solar irradiance. The first part of this movie links the ups and downs to the Sun’s outlook in white light (SDO/HMI). The period stretches from the “low” late May this year till the current “high” in mid-November. Clearly, the peaks in irradiance correspond to a solar hemisphere with many sunspots, whereas the valleys have almost no sunspots at all. The sunspot groups responsible for the higher activity (and irradiance) are grouped on the solar surface in an area of 150° width – between longitudes 65° and 215° in the Carrington heliographic coordinate system.
 Sunspots compared on SDO/HMI Intensitygram (Courtesy of NASA/SDO and the AIA, EVE, and HMI science teams)
The second part of this movie links the days with peak irradiance to the outlook of the entire Sun in EUV, as observed by the SDO/AIA and the two STEREO-spacecraft. Bright areas correspond to active regions.
 Sunspots seen on June 12, 2012 by SDO’s HMI and STEEO Heliograph (Courtesy of NASA/SDO and the AIA, EVE, and HMI science teams / STEREO)
From these movies, one can also see that the regions contributing to the higher irradiance only last for 2 or 3 rotations. Then new active regions on other locations – but still on the same hemispheric face – take over.
Also, as is apparent from the last rotation, things seem to be changing. There were fewer sunspot groups during the peak late October, and the ongoing mid-November peak started actually almost a week too soon (normally +/- 21 November). Indeed, the main sunspot groups are now already appearing between 195° and 265° longitude, a clear shift compared to previous high activity periods. It will be interesting to see if the cycle continues on this hemispheric side, or if the cycle simply fades from view if solar activity gets more spread around the whole Sun.
Source: STCE
[…] Ups and downs in the daily minimum solar irradiance. Share this:TwitterFacebookLinkedInTumblrMoreEmailPrintGoogle +1DiggRedditPinterestStumbleUponLike this:LikeBe the first to like this. […]