
Gulf Stream rapidly intensified after 2014, 31-year satellite record shows
A 31-year satellite altimetry record shows that the Gulf Stream east of about 75°W underwent rapid surface intensification beginning around 2014, shifted northward and became less meandering after a prolonged weaker period. The strengthened state persisted through December 2023, while the study linked the transition to changes in subtropical North Atlantic wind forcing and a spin-up of the subtropical gyre.
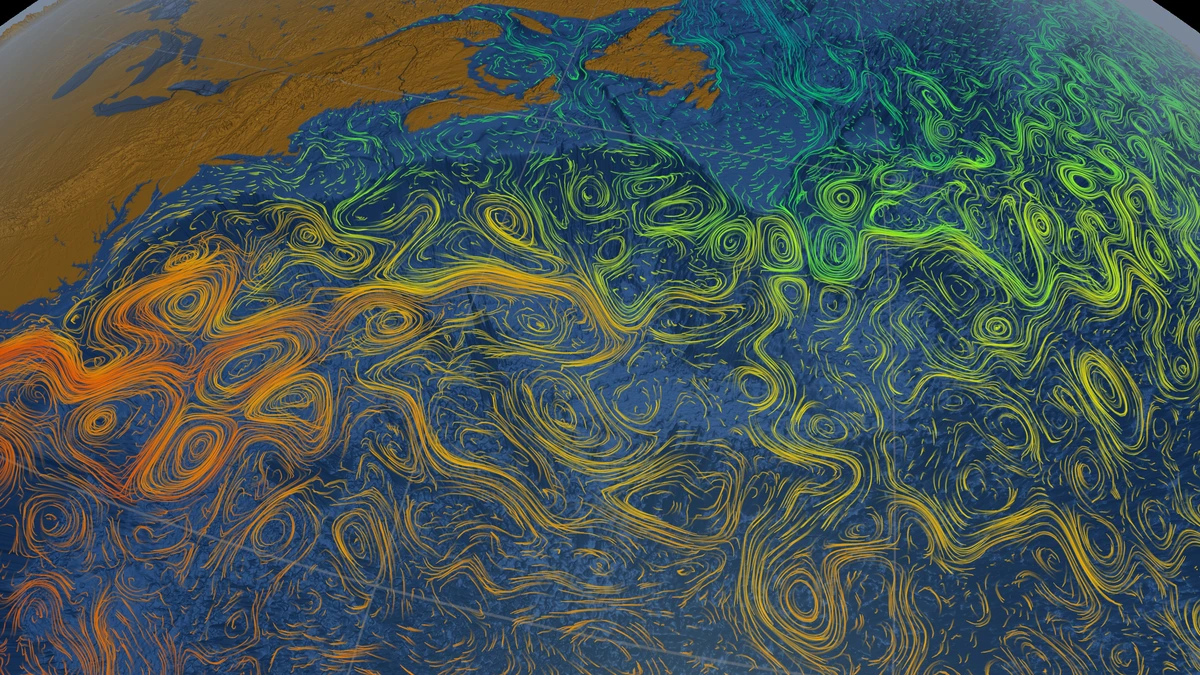
Gulf Stream Sea Surface Currents and Temperatures. Ocean flows colored with sea surface temperature data (includes alpha channel). Credit: NASA/Goddard Space Flight Center Scientific Visualization Studio
Satellite observations from January 1993 through December 2023 captured pronounced interannual-to-decadal changes in the Gulf Stream between 79°W and 50°W. Researchers led by Shenfu Dong of NOAA’s Atlantic Oceanographic and Meteorological Laboratory identified a weak phase from 2005 to 2014 followed by rapid surface intensification east of 75°W beginning around 2014. The work was published in Geophysical Research Letters on August 14, 2026.
The Gulf Stream behaves differently along its path. West of about 75°W, where it flows as a constrained western boundary current, its position and speed were comparatively stable. After separating from the coast, the current becomes a free-flowing jet with larger variations in position and meandering. Mean surface geostrophic speed across the satellite record exceeded 1.7 m/s (3.8 mph) along the Florida coast and decreased downstream to below 1.0 m/s (2.2 mph) near 50°W.
The strongest speed change occurred downstream of 75°W. During 2016–2023, the study found a mean surface-speed anomaly of about 0.14 m/s (0.31 mph). The value is an anomaly rather than the Gulf Stream’s total speed: the researchers calculated monthly anomalies after removing the 1993–2023 monthly climatology and filtered variability with periods shorter than one year.
Faster conditions coincided with a more northerly and less variable Gulf Stream path. Zonally averaged surface speed and meridional position were correlated at r = 0.59 with p = 0.04. NOAA’s summary of the study describes a gradual southward shift and increasing instability from 1993 to 2011, followed from around 2014 by northward displacement, greater path stability and stronger downstream flow.
Researchers also analyzed the difference in sea surface height across the current, ΔH, which serves as a proxy for Gulf Stream transport. Interannual variations in surface speed and ΔH were strongly correlated at r = 0.95 with p = 0.03, although the relationship is not exact because Gulf Stream speed also depends on the width of the current.
Sea surface height required separate treatment because moving the Gulf Stream northward can change local sea level without representing an increase in current strength. During 2016–2023, positive sea surface height anomalies exceeded 0.30 m (0.98 feet) near the Gulf Stream core between 75°W and 69°W. The authors calculated that displacement of the current accounted for about 80% of the local increase in that sector.
After removing the contributions from global-mean sea-level change and Gulf Stream displacement, the remaining sea surface height anomalies formed a dipole east of 75°W, with comparable magnitudes on both sides of the current. The authors said the pattern suggests that changes north and south of the Gulf Stream both contributed to the stronger cross-front sea surface height gradient associated with the intensified state.
Changes were also transmitted downstream. Lagged correlations indicated downstream propagation of Gulf Stream speed variability, with anomalies in the 75°W–70°W sector preceding corresponding anomalies near 50°W by about one year. The wind-forced western boundary transport index reached its maximum correlation with Gulf Stream speed when the index led by one year, at r = 0.52 and p = 0.01. The authors linked the lag to ocean adjustment processes including westward-propagating Rossby waves.
Atmospheric forcing over the subtropical North Atlantic provides one explanation for the observed transition. Sea-level-pressure and wind stress curl anomalies during 2016–2023 corresponded with a stronger Sverdrup gyre, while Gulf Stream speed was correlated with both the North Atlantic Oscillation and East Atlantic Pattern at different lags. Sensitivity simulations with the University of Victoria Earth System Model also supported a role for wind forcing associated with those atmospheric patterns in Gulf Stream variability.
A regional wind stress curl dipole centered on the Gulf Stream was correlated with surface speed at r = 0.60 with p = 0.01 at zero lag. The authors hypothesize that warming associated with Gulf Stream strengthening and northward displacement increases atmospheric boundary-layer instability, affecting near-surface winds and the regional wind stress curl. They state that fully coupled, high-resolution ocean-atmosphere modeling is needed to determine whether the observed atmospheric pattern represents a response to Gulf Stream thermal anomalies or a coupled air-sea feedback.
The satellite measurements have important limits. Gulf Stream speed in the analysis represents surface geostrophic flow derived from altimetry and excludes ageostrophic components. The authors also caution that the finite spatial resolution of the altimetry data can underestimate peak Gulf Stream speed. Strong eddy activity east of 70°W makes identification of the current core more difficult, so the researchers combined maximum surface speed with a sea surface height contour to track the Gulf Stream more reliably.
The analysis used delayed-time daily satellite altimetry fields at 0.125° × 0.125° resolution from multiple missions. Uneven sampling among satellites represented another possible source of error, so the researchers repeated the analysis using a uniformly sampled two-satellite product. The second analysis reproduced the Gulf Stream variability, indicating that sampling differences had little effect on the main result.
The extended record also helps explain why earlier analyses produced different Gulf Stream trends. Dong, Baringer and Goni (2019) found a southward shift and weakening east of 65°W during 1993–2016 but no statistically significant trends in Gulf Stream properties west of 70°W. Their paper also reported a speed increase near the end of the record and stated that the longer-period slowdown could represent part of a decadal variation rather than a persistent trend.
Chi, Wolfe and Hameed (2021), using satellite observations from 1993–2018, found few statistically significant trends in Gulf Stream latitude, speed, transport and width and showed that small changes in record length produced large changes in calculated trends. Assuming the detected trends continued at the same rates and future Gulf Stream variability resembled that in the observed record, they estimated that another 22–23 years of observations would be required to detect latitude and transport trends at more than half of the satellite tracks and 44 additional years for speed. The authors cautioned that the assumption of stable trends was itself unlikely to hold.
The new observations matter beyond measurements of current speed. NOAA states that variations in Gulf Stream strength and position affect North Atlantic heat transport, ocean-atmosphere heat exchange, coastal sea level, marine ecosystems, and regional weather and climate. A stronger current can transport more heat toward higher latitudes, but the effects depend on where and how the Gulf Stream changes.
The downstream intensification cannot be translated directly into strengthening of the Atlantic Meridional Overturning Circulation (AMOC). NOAA cautions that different sections of the circulation respond to different forcing mechanisms and describes the Gulf Stream as one component of the wider AMOC system. The 2026 study documents rapid surface Gulf Stream intensification through 2023; it does not establish an equivalent change in the AMOC or a continuing Gulf Stream acceleration after the end of the satellite record analyzed.
Further observations and coupled high-resolution modeling are needed to determine how much of the regional atmospheric response is forced by Gulf Stream changes and how much arises from two-way air-sea interaction. The available satellite record establishes the post-2014 transition through December 2023 while leaving the subsequent evolution outside the observational period examined in the study.
References:
1 Dong, S., Goes, M., Volkov, D., Lee, S.-K., & Lopez, H. (2026). Rapid surface intensification of the Gulf Stream since 2014. Geophysical Research Letters, 53(16), e2026GL122338. https://agupubs.onlinelibrary.wiley.com/doi/full/10.1029/2026GL122338

I’m a science journalist and researcher at The Watchers, contributing to the Epicenter edition, where I cover peer-reviewed scientific research and emerging discoveries across Earth and space sciences. With a background in astronomy and a passion for environmental science, I’ve worked in shark and coral conservation in Fiji, conducting reef and shark-behavior research, contributing to mangrove restoration, and earning PADI Open Water and Coral Reef Certifications. I bring a blend of scientific rigor and storytelling to illuminate the discoveries shaping our planet and beyond.
Published in the last 24 hours
- 10 named storms, one hurricane for the first time since 1925: Why has the Atlantic been so quiet in 2026 Epicenter
- A fireball over northern China on 6 November 2026 punched a crater into a wheat field at Beigucheng village in Hebei; the Institute of Geochemistry has now classified the fallen stones as L6 ordinary chondrites. Epicenter
- Weather radar tracked meteorites falling into Cape Cod Bay after a 1.1-kiloton fireball over Massachusetts on 30 May 2026; researchers have now traced its orbit almost out to Jupiter. Epicenter
- Bay of Bengal system to become Cyclone Akvan, landfall forecast between Nellore and Tuni on November 20, India
