
El Niño reaches 2.0°C on NOAA’s index, a tenth of a degree behind 1997–98 at the same point, as forecasters expect it to challenge the all-time record this winter
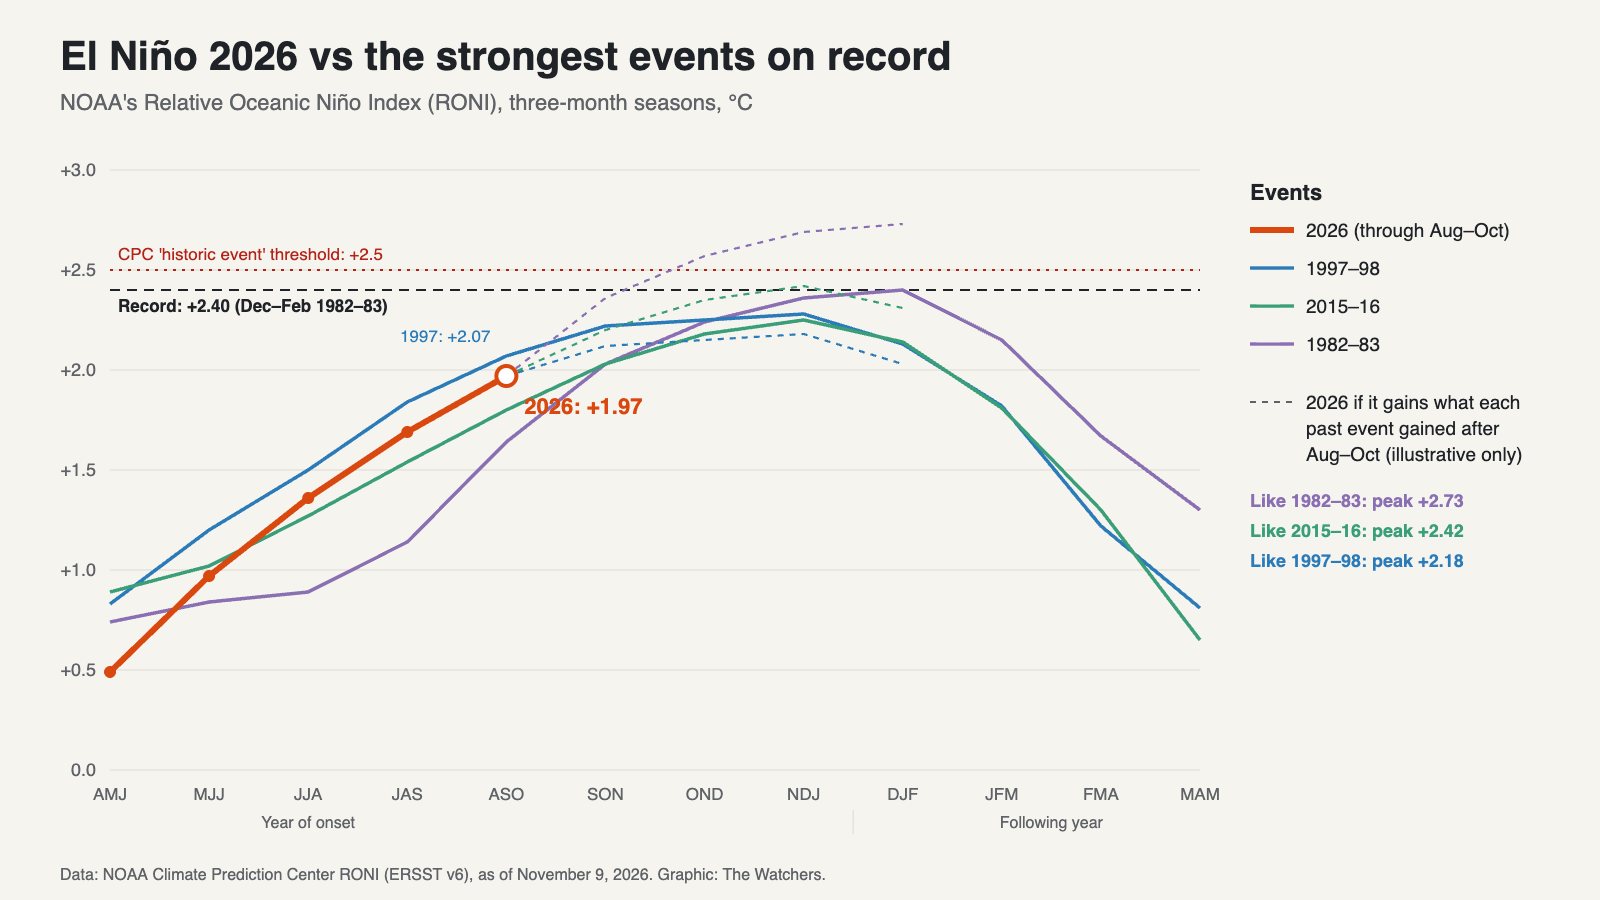
El Niño reached +2.0°C on NOAA’s official index for August to October 2026, the second-highest reading for that time of year since records began in 1950. Only the 1997–98 event, one of the strongest on record, was higher at the same point, by a tenth of a degree. NOAA forecasters have put the chance that it surpasses every El Niño since 1950 by the end of the year at 83%.
The figure comes from the Relative Oceanic Niño Index (RONI), which NOAA’s Climate Prediction Center (CPC) uses as its principal measure of El Niño strength. In its weekly update of November 9, CPC put the August–October value at 2.0°C. The full data table gives it as +1.97°C, compared with +2.07°C for August–October 1997. The latest values are provisional: because of the filtering applied to the underlying sea surface temperature data, NOAA notes that RONI values may change up to two months after they are first posted, so a gap this small could still shift.
Closing in on 1997
The 2026 event has tracked just behind 1997–98 for months, and the gap narrowed in the latest reading. In June–August, 2026 was 0.14°C behind. In July–September it was 0.15°C behind, and in August–October 0.10°C.
| Season (RONI, °C) | 1982–83 | 1997–98 | 2015–16 | 2026 |
|---|---|---|---|---|
| June–August | +0.89 | +1.50 | +1.27 | +1.36 |
| July–September | +1.14 | +1.84 | +1.54 | +1.69 |
| August–October | +1.64 | +2.07 | +1.80 | +1.97 |
| Peak | +2.40 (Dec–Feb) | +2.28 (Nov–Jan) | +2.25 (Nov–Jan) | Ongoing |
The current event has already moved past 2015–16 for this time of year. That El Niño stood at +1.80°C in August–October 2015 and peaked at +2.25°C that winter. The highest three-month value in NOAA’s record is +2.40°C, set in December–February 1982–83.
What happens next depends on how much more the event strengthens. Past events show a wide range. From August–October to their peaks, the RONI rose by 0.21°C in 1997–98, 0.45°C in 2015–16 and 0.76°C in 1982–83. If 2026 gained as much as 1997–98 did, it would peak near +2.18°C and fall short of the record. A gain like 2015–16’s would bring it to about +2.42°C, just above the record, and one like 1982–83’s would carry it to about +2.73°C. These are comparisons with past events, not forecasts.
What forecasters expect
CPC’s official forecast points toward a record. In its October 8 ENSO discussion, the agency said the chances “remain high for a historic event” that would exceed the strength of every El Niño since 1950, which it defines as a three-month RONI of +2.5°C or more. It gave that outcome an 83% chance for October–December and 70% for November–January.
CPC expects a strong to very strong El Niño to last through January–March 2027, with El Niño persisting through March–May 2027. ENSO-neutral conditions are favored by April–June. The CFS.v2 forecast model, run on November 9, also favors El Niño continuing through the Northern Hemisphere winter.
There are early signs that the build-up beneath the surface may be leveling off. CPC notes that warm subsurface temperature anomalies in the central and eastern Pacific held steady from August to mid-October and have decreased slightly since then. Surface waters remain very warm. The latest weekly relative reading for the Niño 3.4 region, where El Niño strength is measured, was +2.3°C. Farther east, in the Niño 1+2 region off Peru and Ecuador, it was +4.7°C.
CPC’s next monthly ENSO discussion is due on November 12 and will update the record odds.
Why the numbers differ
Readers following this El Niño have seen several different figures, and most of them are higher than NOAA’s official one.
The RONI takes sea surface temperature departures in the Niño 3.4 region and subtracts the average departure across the whole tropics, between 20°N and 20°S. Because the tropical oceans as a whole have warmed, this removes a background warming that would otherwise make recent El Niños look stronger than older ones. The result is then scaled so it remains comparable with the traditional index.
On the traditional measure, which does not subtract that background, 2026 is further ahead. The weekly traditional Niño 3.4 anomaly was +3.3°C in the week centered on November 4, according to CPC’s weekly data, and the traditional Oceanic Niño Index for August–October 2026 was +2.46°C, against +2.04°C in 1997 and +2.02°C in 2015. On daily data, the region was 3.08°C above average on September 21, beating the previous daily high of 3.02°C set in November 2015, Science News Explores reported.
NOAA has not declared a record because, on its official relative index, the 1982–83 peak still stands.
Effects already showing
CPC cautions that an event of this size makes typical El Niño impacts more likely, though not guaranteed. Some are already appearing in the United States. As of early November, the Atlantic hurricane season had produced only one hurricane, the fewest since 1925, and cities including Albuquerque, Flagstaff and West Palm Beach had recorded their wettest fall to date, through November 4, The Weather Company reported. The Weather Company cited meteorologist Eric Webb as saying that typical El Niño winter impacts had begun over the U.S. one to two months early.
The typical El Niño winter pattern brings a more active storm track across the southern U.S. and milder, drier conditions across much of the north. Whether this winter follows that pattern will depend partly on how much stronger the event becomes over the next two months.
References:
1. NOAA Climate Prediction Center. (2026, November 9). ENSO: Recent evolution, current status and predictions.
2. NOAA Climate Prediction Center. (2026, October 8). ENSO diagnostic discussion.
3. NOAA Climate Prediction Center. Relative Oceanic Niño Index (ERSST v6).
4. NOAA Climate Prediction Center. Oceanic Niño Index.
5. Ogasa, N. (2026, October 5). 2026’s El Niño is record-breaking, and it’s not done yet. Science News Explores.
6. Erdman, J. (2026, November 5). Super El Niño nears a record, and the weather looks like it. The Weather Company.
7. NOAA Climate Prediction Center. Relative Oceanic Niño Index (RONI).

The Watchers Staff covers earthquakes, volcanoes, severe weather, space weather and other natural events. Published since 2011, The Watchers reports on a changing planet and the science behind it.
Published in the last 24 hours
- The fastest wind gust ever measured on Earth, 253 mph, hit an oil island off Australia during Cyclone Olivia in 1996, and nobody noticed for more than a decade, until experts reading old data quietly took the record from New Hampshire's Mount Washington Epicenter
- In 1954, a grapefruit-sized meteorite crashed through a roof in Sylacauga, Alabama, and struck Ann Hodges as she napped on her couch Epicenter
- A meteorite blew a crater beside a village near Lake Titicaca in 2007, and dozens of villagers who went to see it got headaches and nausea, though tests found nothing the rock had added to the water Epicenter
- The people who pay closest attention to the weather are the ones storms have already cost the most, a study of 946 students found, with one damaging storm making little difference to how much attention a student paid, but two or more making a clear one Epicenter
