
Flood flow at Buller River the largest in New Zealand since 1926
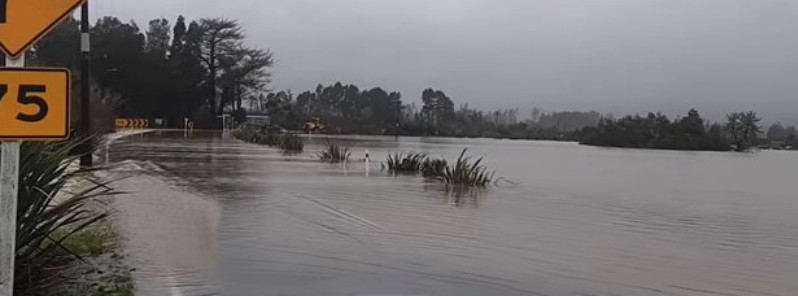
Image credit: NIWA
Flood flows on the Buller River in July 2021 were the largest of any river in New Zealand in almost 100 years, NIWA measurements show.
Mike O'Driscoll, NIWA Environmental Monitoring Technician, used radar to measure the speed at the surface of Buller River from the Westport and Orowaiti Bridges on July 17, 2021. These measurements, along with surveys of the riverbed conducted from a jet boat after the flood, provided the data for calculating the flood discharge at the bridges.
When the bridges were closed, the measurements gave a flow of 7 640 m3 (2 328 feet3) per second – which is now the largest direct measurement of river flow ever made in New Zealand. The previous record was 5 870 m3 (1789 feet3) per second taken in 1988 at Grey River. By comparison, the mean flow of the Buller River is 454 m3 (138 feet3) per second.
"We can confidently say that the recent flood flows in the Buller River are the highest of any river in New Zealand since 1926, when historic records and photographs of flooding show an even bigger flood on the Buller," Measures said.
NIWA monitoring station at Buller River at Te Kuha, about 10 km (6.2 miles) upstream, continuously recorded water levels throughout the flood. The monitoring station is part of NIWA's national network of hydrometric reference gauging stations and is an important site for flood forecasting at West Coast Regional Council.
The station has three independent monitoring systems because of its importance – a sensor system for rapid updates during floods, and primary and backup sensors to record data for future analysis. However, two sensors failed due to the extent of the flooding, leaving only the backup system to provide real-time information for emergency management decisions.
The water level at Te Kuha peaked at 12.8 m (42 feet) at 13:35 LT on Saturday, July 17, several hours ahead of the Westport flood. In the 1970 flood, the high was 11.9 m (39 feet). This was the largest flood recorded since the Te Kuha monitoring site was established in 1963.
Work is now ongoing to gather more data to refine the flood analysis and NIWA’s flood flow forecasting tool.
I'm a dedicated researcher, journalist, and editor at The Watchers. With over 20 years of experience in the media industry, I specialize in hard science news, focusing on extreme weather, seismic and volcanic activity, space weather, and astronomy, including near-Earth objects and planetary defense strategies. You can reach me at teo /at/ watchers.news.
Commenting rules and guidelines
We value the thoughts and opinions of our readers and welcome healthy discussions on our website. In order to maintain a respectful and positive community, we ask that all commenters follow these rules.