
Global sea surface temperature sets new record, reaching 21.1°C (70°F) as El Niño strengthens
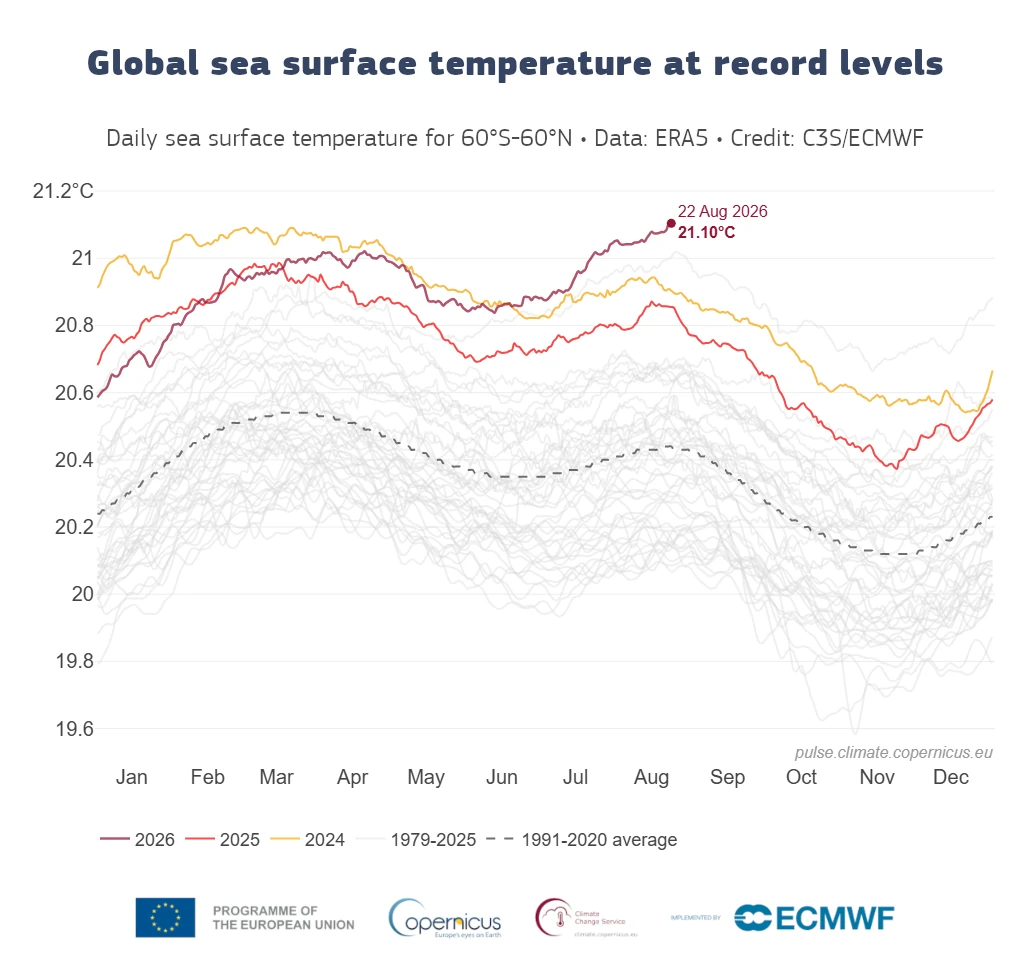
The daily average sea surface temperature across the extra-polar global ocean, between 60°S and 60°N, reached 21.1°C (70°F) on August 22, 2026, the highest value in the Copernicus Climate Pulse record beginning in 1979. The reading exceeded the previous daily record of 21.09°C (69.96°F), set in March 2024, and came in August, although temperatures across the domain normally reach their annual maximum in March and April.

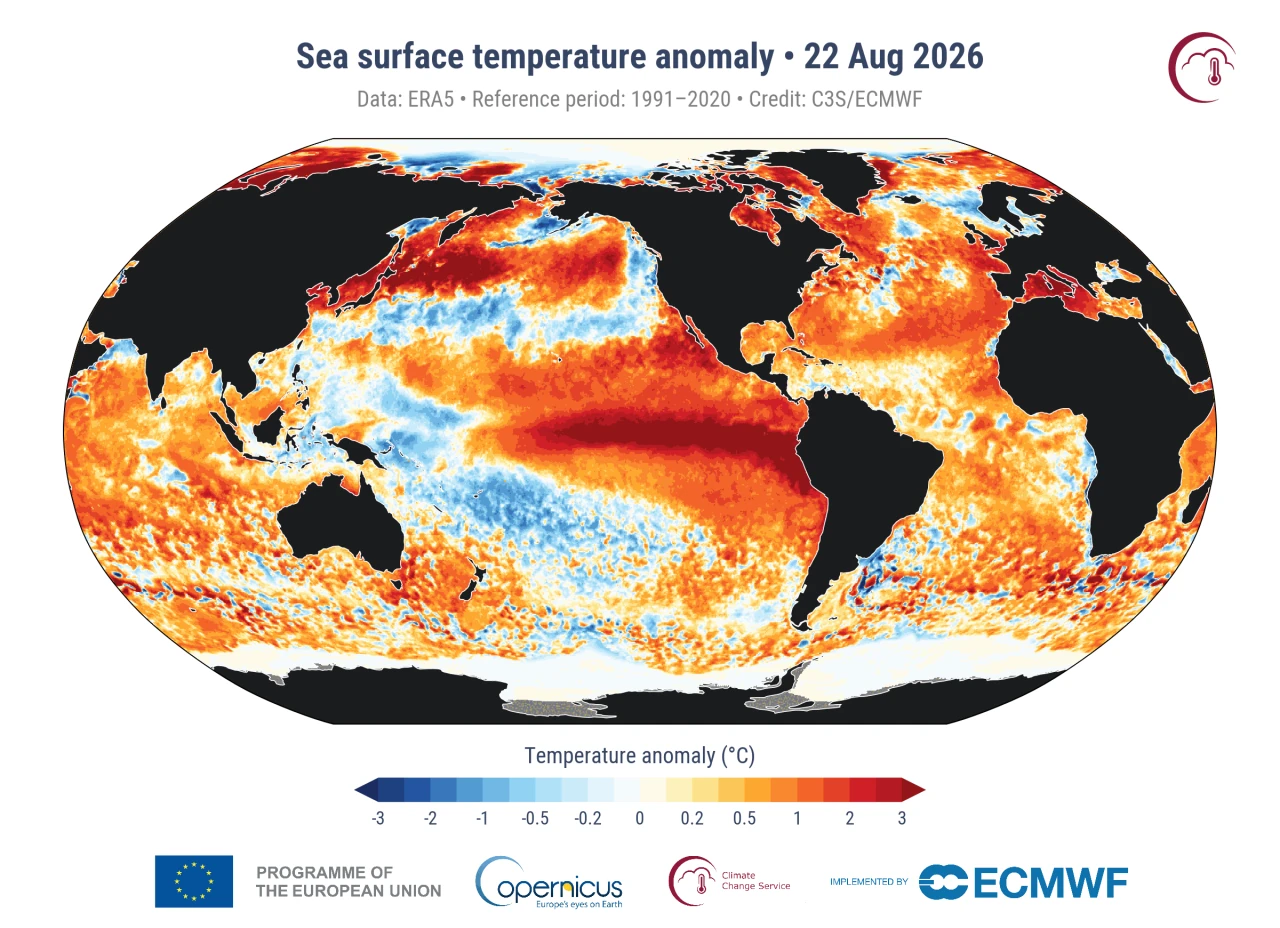
Anomalies in sea surface temperature for August 22, 2026. Data source: ERA5. Credit: C3S/ECMWF.
The daily average sea surface temperature across the extra-polar global ocean, between 60°S and 60°N, reached 21.1°C (70°F) on August 22, the highest value in the Copernicus Climate Pulse record beginning in 1979.
The Copernicus Climate Change Service (C3S), implemented by the European Center for Medium-Range Weather Forecasts (ECMWF), calculates the value from ERA5 sea-surface temperature data averaged across 60°S–60°N.
ERA5 represents foundation temperature at approximately 10 m (33 feet) depth rather than the temperature of the entire ocean water column. Although ERA5 contains SST data back to 1940, Climate Pulse uses January 1979 onward because satellite observations make that portion of the record more reliable.
The August timing places the new record outside the usual annual maximum. Sea-surface temperatures across the domain are generally highest in March and April following austral summer, while the previous highest August value was 20.98°C (69.76°F) in 2023. Record and near-record temperatures persisted across much of the extra-polar ocean during 2026 before the August 22 maximum.
The National Oceanic and Atmospheric Administration’s (NOAA) Climate Prediction Center (CPC) maintained an El Niño Advisory on August 13 as the event strengthened.
July anomalies reached +1.4°C (+2.5°F) in Niño-3.4, +1.7°C (+3.1°F) in Niño-3 and +2.9°C (+5.2°F) in Niño-1+2. Subsurface anomalies reached +10.0°C (+18.0°F) at depth in parts of the equatorial Pacific, while the coupled ocean–atmosphere system continued to reflect strengthening El Niño conditions.
NOAA assigned a greater than 90% chance of a very strong El Niño during Northern Hemisphere fall and winter 2026–27. Its August assessment also gave a 69% probability that the October–December RONI reaches at least +2.5°C (+4.5°F), which would exceed previous El Niño events in NOAA’s record dating to 1950. NOAA cautioned that even an event of that magnitude would not guarantee the typical El Niño impacts in every region.
The World Meteorological Organization (WMO) also forecast continued intensification during August–October. Its multi-model ensemble places the seasonal-average sea-surface temperature anomaly near +2.9°C (+5.2°F) in key El Niño monitoring regions, with the intensification trajectory peaking in November.
WMO expects El Niño to influence global temperature and precipitation patterns, favoring wetter conditions in some regions and increasing drought risk in others.
C3S placed the record within the long-term rise in ocean temperatures caused by human-driven climate change, with the developing El Niño providing additional surface warmth.
Warmer ocean water expands, contributing to sea-level rise, while sustained anomalous warmth increases exposure to marine heatwaves. C3S reported that the global number of marine-heatwave days has more than tripled since the early 1990s, placing greater pressure on coral reefs, seagrass ecosystems, marine food webs, fisheries and aquaculture.
A warmer ocean also transfers more heat and moisture to the atmosphere, potentially intensifying rainfall and some storm systems. Copernicus noted that higher ocean temperatures can also reduce the ocean’s ability to absorb carbon dioxide from the atmosphere.
ECMWF scientists working for C3S are monitoring the record to determine whether it represents a temporary exceedance or the beginning of a more persistent period. NOAA’s next ENSO Diagnostic Discussion is scheduled for September 10, 2026.
References:
1 Daily global sea surface temperature breaks 2024 record — Copernicus Climate Change Service / ECMWF — August 24, 2026.

Rishav Kothari is Editor-in-Chief of The Watchers, where he runs the newsroom and covers earthquakes, volcanoes, severe weather and space weather.
Published in the last 24 hours
- A ring of wind spinning about 19 miles above the Arctic, far higher than any passenger jet flies, has started breaking apart weeks earlier than ever recorded, and forecasters say the cold it was holding in place could spill into the US and Europe within weeks
- In 1943, a flight instructor in Texas flew a two-seat training plane into the eye of a hurricane because he was curious, then landed and took the base weatherman up for a second pass Epicenter
- A soy sauce maker used fire to guide villagers through Japan’s 1854 tsunami, then funded a seawall that protected most of Hiro in 1946 Epicenter
- In 2013 a landslide fell onto Svínafellsjökull in southeast Iceland, leaving thicker ice at the foot of the slope; that ice is now moving away and the mountainside has shifted 1 to 3 cm. Epicenter

Red; 20th Century The Hammer & Sickle Lenin’s fist, 21st Century The Alarming Heat Map. Same psychological tactic 100 years later.
Barry, yes.
Heat from the abyss?? Thermal flux, from the mantle? Think critically. Look at the distribution. Think.
And why a deafening silence on this possibility?? Science is.. to have an open mind. If from the abyss, why? The heat-source energy-physics of this spinning body, and its instability. Yes is all entropy but it goes a layer or two deeper, its own abyss, classified but it’s a physics fundament, look, think, it is in plain-sight! It is all related. Accelerations in the field.