
Over 700 landslides and avalanches mapped after M7.0 2025 Hubbard Glacier Earthquake
A strong M7.0 oblique-slip earthquake struck beneath the Hubbard Glacier in the St. Elias Mountains, about 89 km (55 miles) north of Yakutat, Alaska, at 11:40 AKST (20:40 UTC) on December 6, 2025. The quake triggered widespread ground failures, with over 700 landslides and snow avalanches identified across Alaska and Canada. The largest and most concentrated slope failures occurred within a 16 km (10 miles) wide band along the estimated fault rupture.
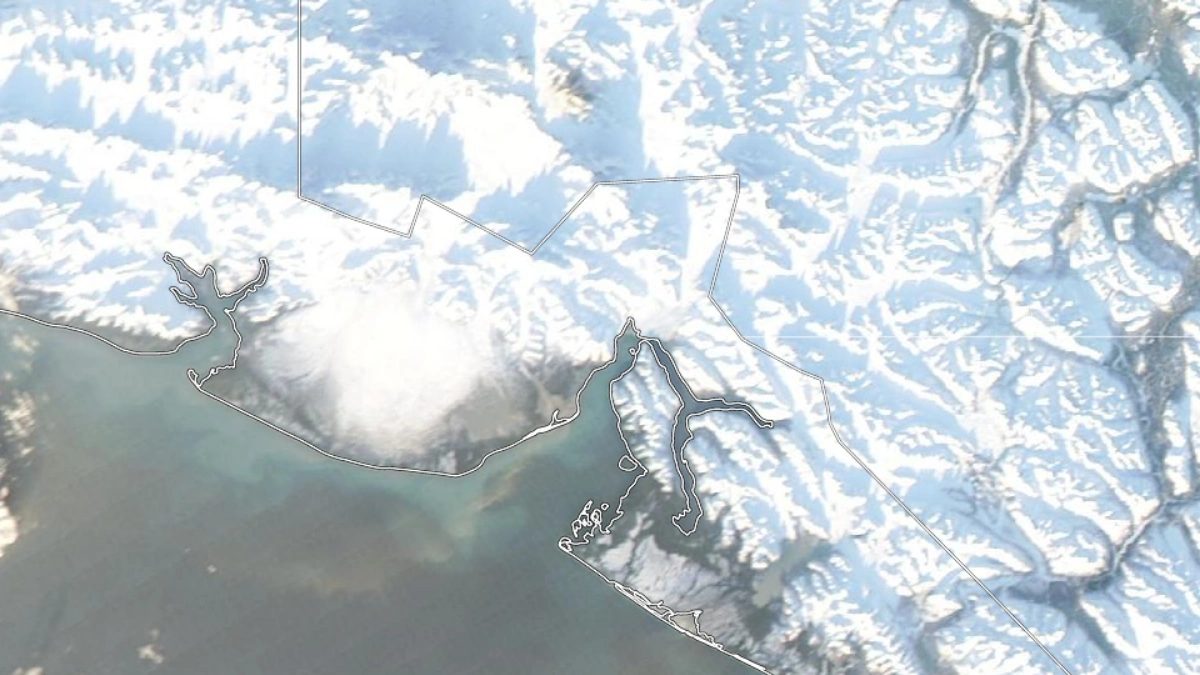
Satellite image of Yakutat, Alaska on December 11, 2025. Credit: NOAA/GOES-19, Zoom Earth, The Watchers
The M7.0 earthquake struck about 10 km (6 miles) below the Hubbard Glacier in the St. Elias Mountains. According to the United States Geological Survey (USGS), ground failure probabilities were high across a broad zone north of Yakutat.
A subsequent preliminary remote sensing assessment confirmed that the event triggered extensive landslides and snow avalanches on both sides of the Alaska–Canada border.
Due to persistent cloud cover and limited daylight, optical satellite imagery was initially ineffective. The USGS used synthetic aperture radar (SAR) change detection to map surface disturbances.
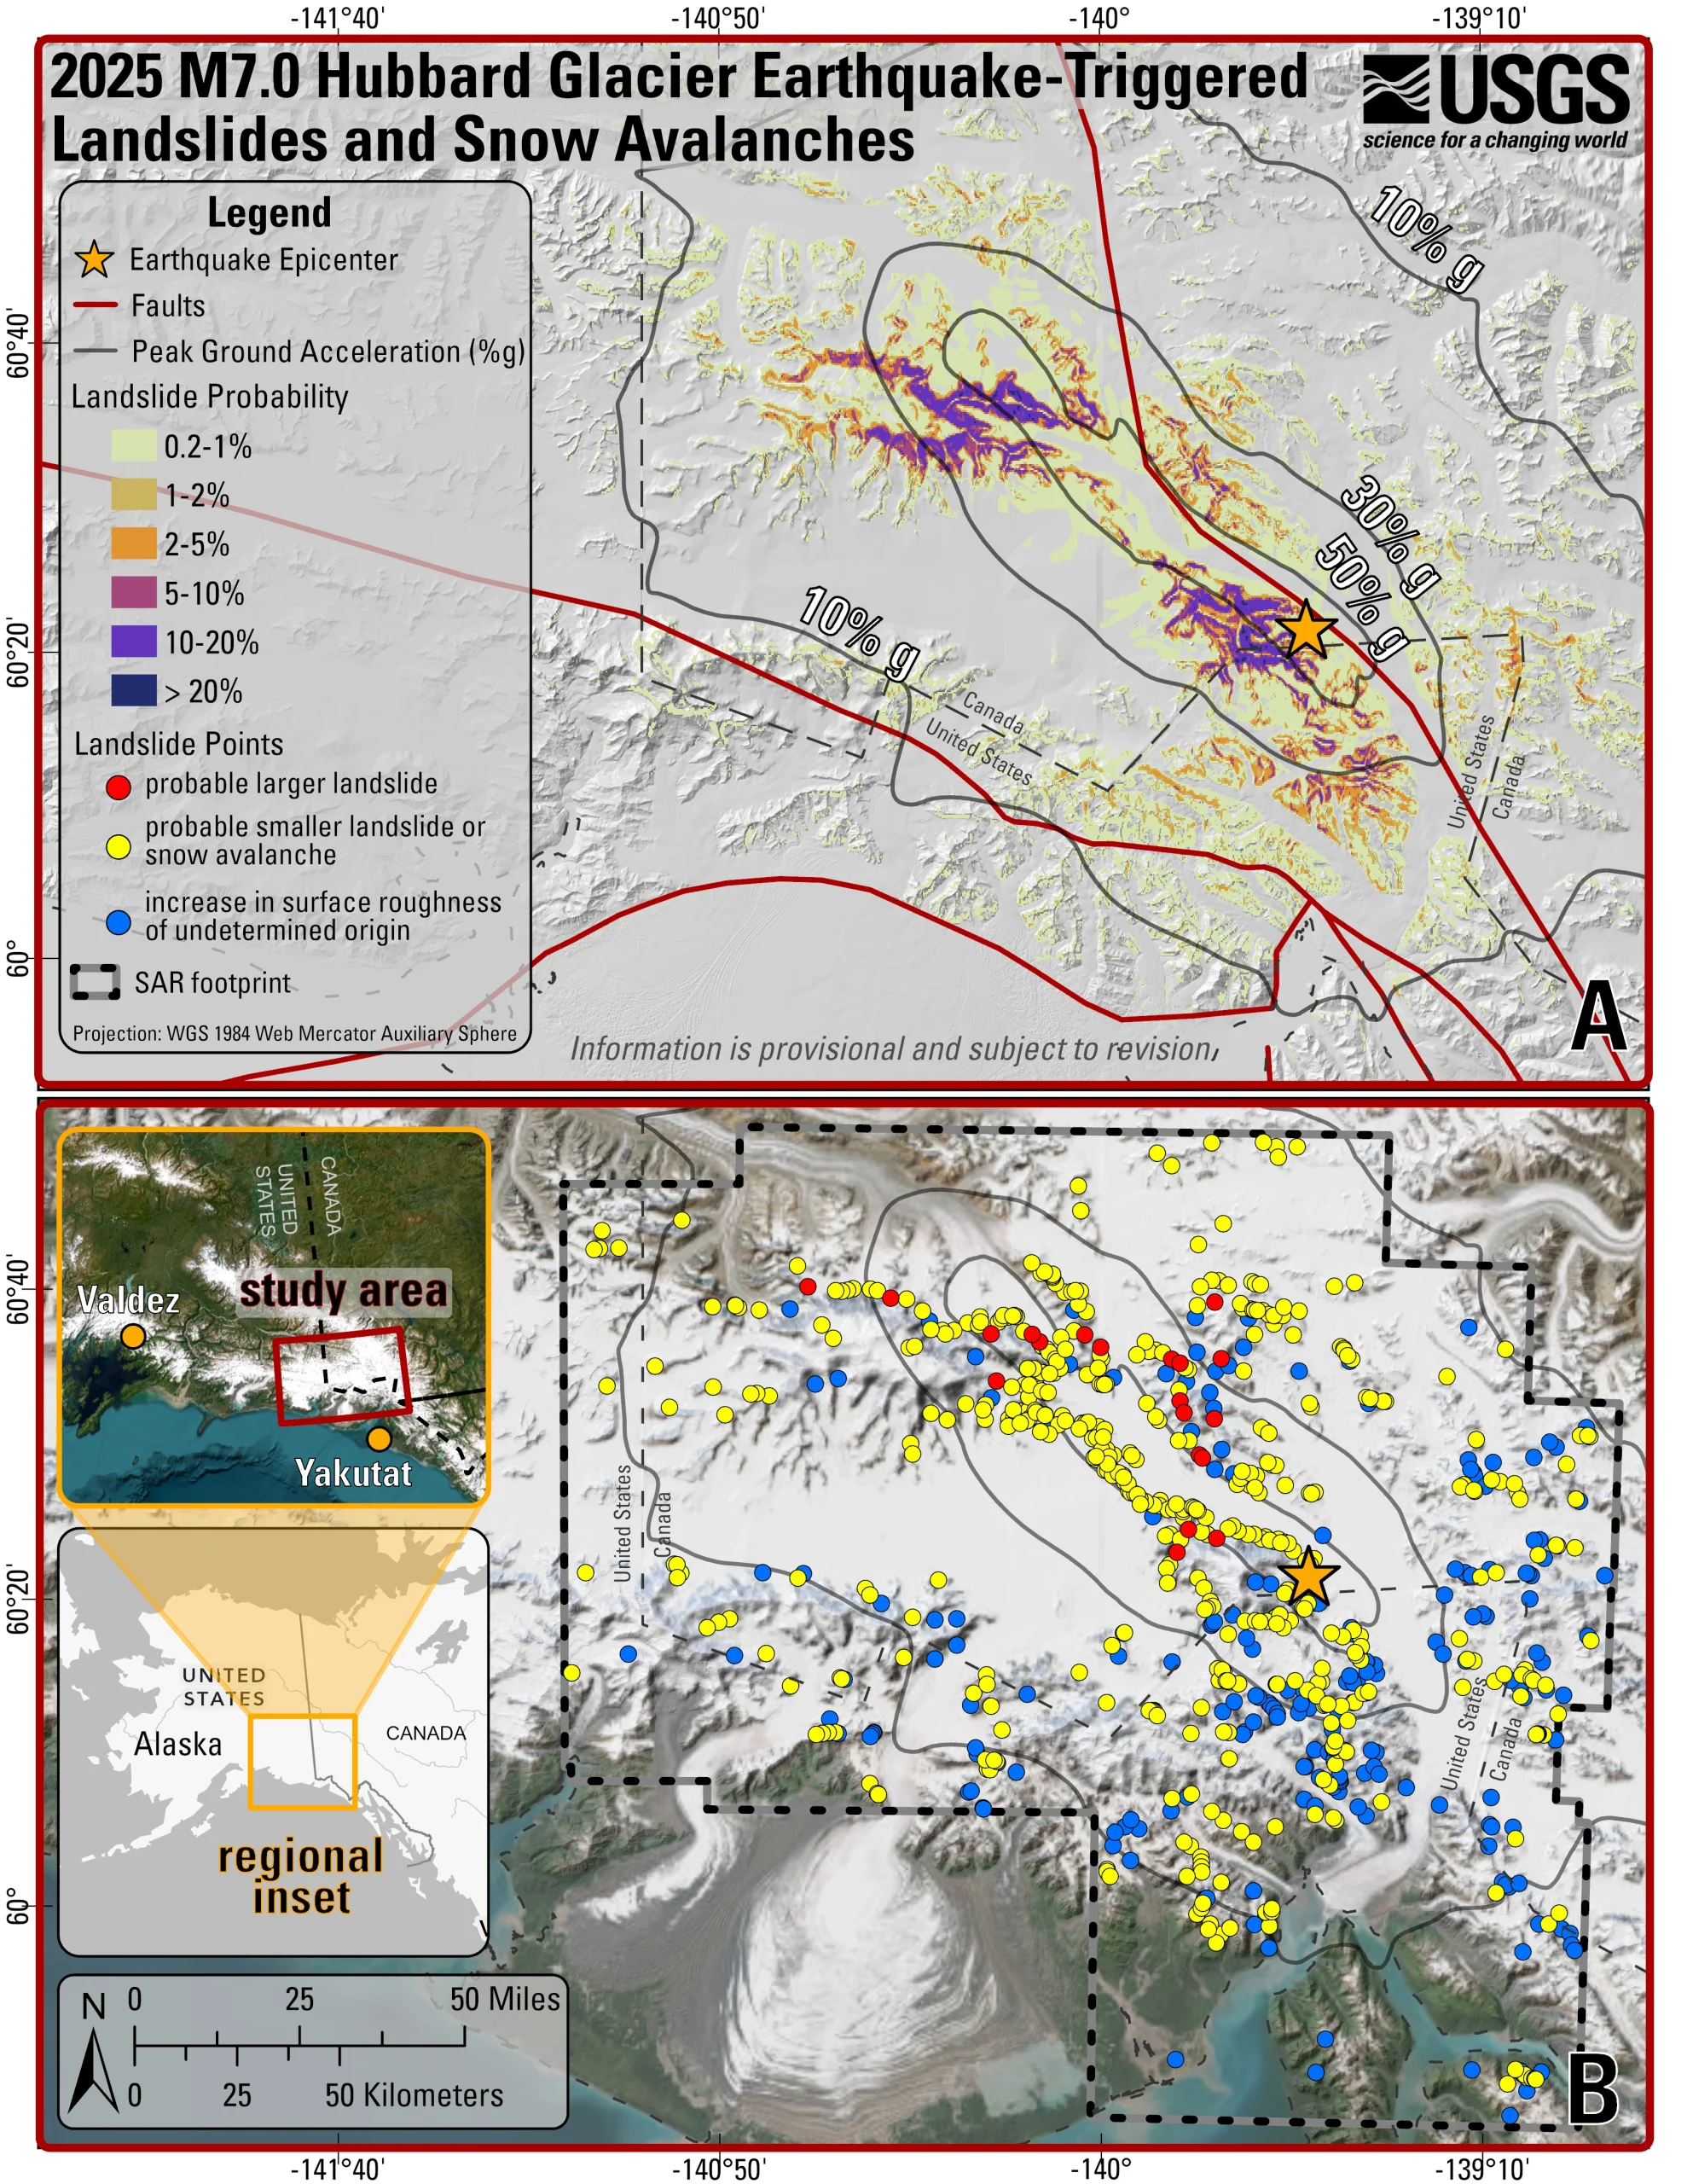
SAR is an active remote sensing technique that transmits microwave pulses and records their reflections from the surface, allowing data collection during cloudy and night-time conditions. By comparing pre- and post-event SAR backscatter data, the USGS identified areas where changes in surface roughness indicated potential mass movements such as landslides or avalanches.
In snowy and mountainous terrain, multiple processes, such as snowfall, surface moisture change, glacier motion, or avalanching, can alter surface roughness. To differentiate between earthquake-induced failures, USGS scientists combined SAR data with topographic and regional information.
The analysis revealed over 700 probable slope failures, with the highest density concentrated along a 16 km (10 miles) wide zone extending approximately 48 km (30 miles) northwest of the epicenter.
Twenty-one large landslides showed distinct lobate deposits longer than 2 km (1.2 miles). While some could be snow avalanches, their surface roughness and morphology suggest landslides on glacier surfaces. Around 500 smaller failures, typically between 90 m and 2 km (300 feet and 1.2 miles) in length, were mapped across the broader region.
Another 200 zones showed roughness changes consistent with downslope movement but lacked clear depositional morphology, introducing interpretive uncertainty. Several of these features were seen on glacier ice and may include glacier-surface deformation or snow avalanches.
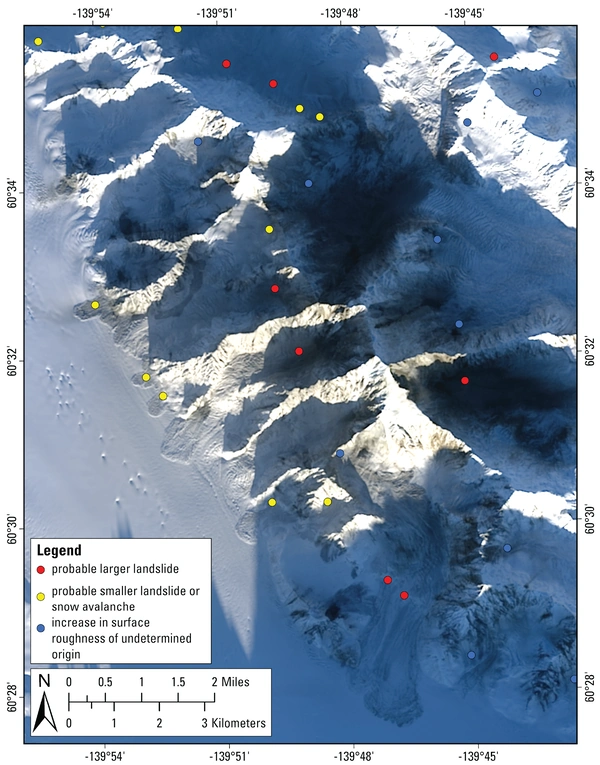
Some of the largest slides occurred on the flanks of Mount Logan, Canada’s highest peak. Preliminary runout measurements indicate that numerous large landslides may have traveled more than 6 km (3.5 miles).
Follow-up Landsat 9 imagery confirmed landslide deposits containing variable mixtures of rock, snow, and ice. In some locations, deposits identified in SAR data were fully snow-covered in optical imagery, suggesting they were subsequently buried by new snowfall.

I am an Assistant Editor and Severe Weather & Science Journalist at The Watchers, specializing in real-time severe weather coverage, geophysical event reporting, and research-driven scientific analysis. You can reach me at rishav(at)watchers(.)news.
Commenting rules and guidelines
We value the thoughts and opinions of our readers and welcome healthy discussions on our website. In order to maintain a respectful and positive community, we ask that all commenters follow these rules.