
New Mars’ gravity map released
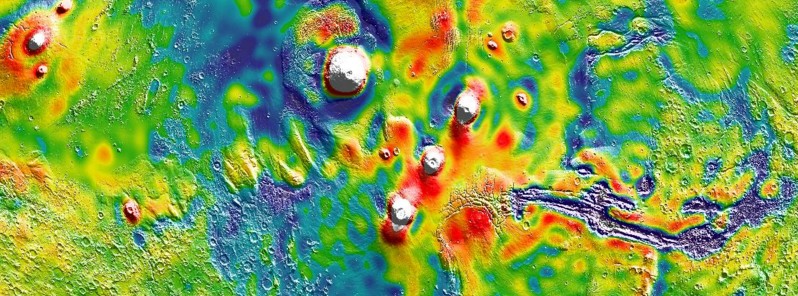
Image credit: MIT/UMBC-CRESST/GSFC
A new map of Mars' gravity was released this month, providing a glimpse into the hidden interior of the planet. The map, most detailed to date, was derived using Doppler and range tracking data collected by NASA's Deep Space Network from three NASA spacecraft in orbit around Mars: Mars Global Surveyor, Mars Odyssey, and the Mars Reconnaissance Orbiter.
The improved resolution of the new gravity map suggests a new explanation for how some features formed across the boundary that divides the relatively smooth northern lowlands from heavily cratered southern highlands. By analyzing tides in the Martian crust and mantle caused by the gravitational pull of the Sun and Mars' two moons, the team confirmed that Mars has a liquid outer core of molten rock.
Finally, by observing how Mars' gravity changed over 11 years – the period of an entire cycle of solar activity – the team inferred the massive amount of carbon dioxide that freezes out of the atmosphere onto a Martian polar ice cap when it experiences winter. They also observed how that mass moves between the south pole and the north pole with the change of season in each hemisphere. The new gravity solution improved the measurement of the Martian tides, which will be used by geophysicists to improve the model of Mars' interior.
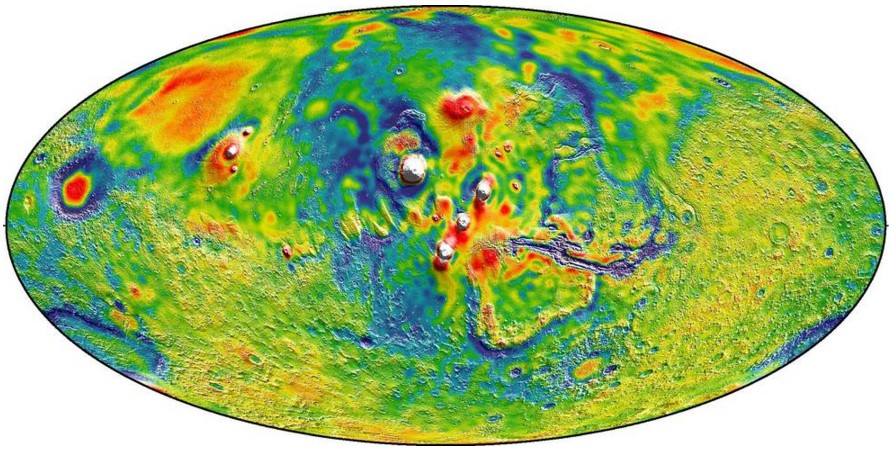
A Martian gravity map showing the Tharsis volcanoes and surrounding flexure. The white areas in the center are higher-gravity regions produced by the massive Tharsis volcanoes, and the surrounding blue areas are lower-gravity regions that may be cracks in the crust (lithosphere). Credit: MIT/UMBC-CRESST/GSFC
The gravity field was recovered using about 16 years of data that were continuously collected in orbit around Mars. However, orbital changes from uneven gravity are tiny, and other forces that can perturb the motion of the spacecraft had to be carefully accounted for, such as the force of sunlight on the spacecraft's solar panels and drag from the Red Planet's thin upper atmosphere. It took two years of analysis and computer modeling to remove the motion not caused by gravity.
"With this new map, we've been able to see gravity anomalies as small as about 100 km (about 62 miles) across, and we've determined the crustal thickness of Mars with a resolution of around 120 km (almost 75 miles)," said Antonio Genova of the Massachusetts Institute of Technology (MIT), lead author of the paper published March 5 in the journal Icarus. "The better resolution of the new map helps interpret how the crust of the planet changed over Mars' history in many regions."
For example, an area of lower gravity between Acidalia Planitia and Tempe Terra was interpreted before as a system of buried channels that delivered water and sediments from Mars' southern highlands into the northern lowlands billions of years ago when the Martian climate was wetter than it is today. The new map reveals that this low gravity anomaly is definitely larger and follows the boundary between the highlands and the lowlands. This system of gravity troughs is unlikely to be only due to buried channels because in places the region is elevated above the surrounding plains. The new gravity map shows that some of these features run perpendicular to the local topography slope, against what would have been the natural downhill flow of water.
Alternative explanation is that this anomaly may be a consequence of a flexure or bending of the lithosphere – the strong, outermost layer of the planet – due to the formation of the Tharsis region, a volcanic plateau thousands of miles across with the largest volcanoes in the Solar System. As the Tharsis volcanoes grew, the surrounding lithosphere buckled under their immense weight.
Changes in Martian gravity over time have been previously measured using the MGS and ODY missions to monitor the polar ice caps. For the first time, the team used MRO data to continue monitoring their mass. The team has determined that when one hemisphere experiences winter, approximately 3 trillion to 4 trillion tons of carbon dioxide freezes out of the atmosphere onto the northern and southern polar caps, respectively. This is about 12 to 16 percent of the mass of the entire Martian atmosphere. NASA's Viking missions first observed this massive seasonal precipitation of carbon dioxide. The new observation confirms numerical predictions from the Mars Global Reference Atmospheric Model – 2010.
The new map will be helpful for future Mars exploration because better knowledge of the planet's gravity anomalies helps mission controllers insert spacecraft more precisely into orbit about Mars. Furthermore, the improved resolution of our gravity map will help us understand the still-mysterious formation of specific regions of the planet.
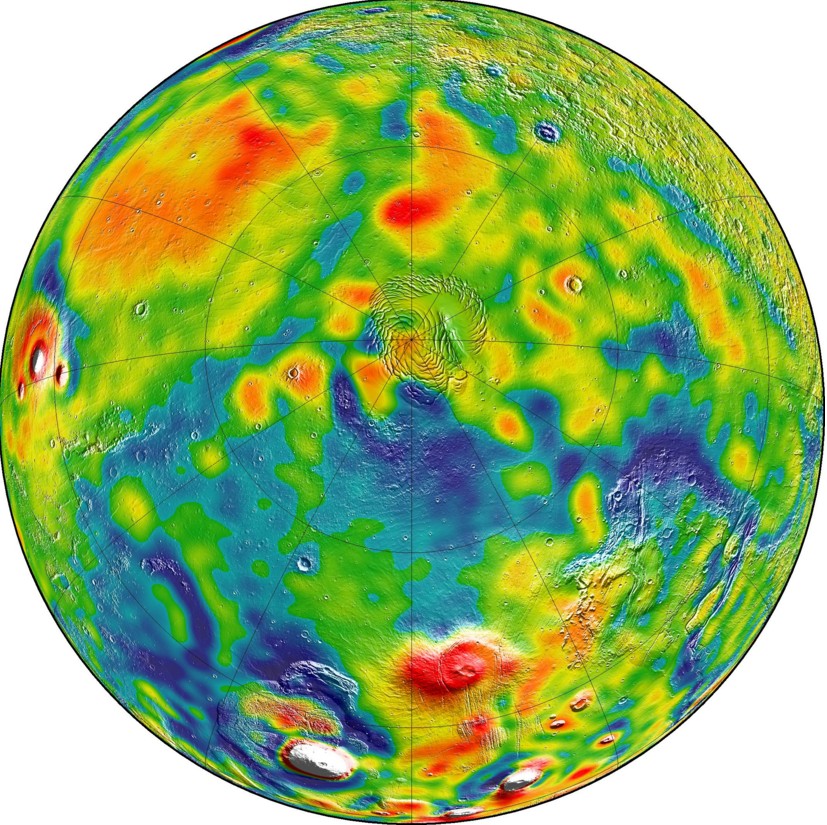
A map of Martian gravity looking down on the North Pole (center). White and red are areas of higher gravity; blue indicates areas of lower gravity. Credit: MIT/UMBC-CRESST/GSFC
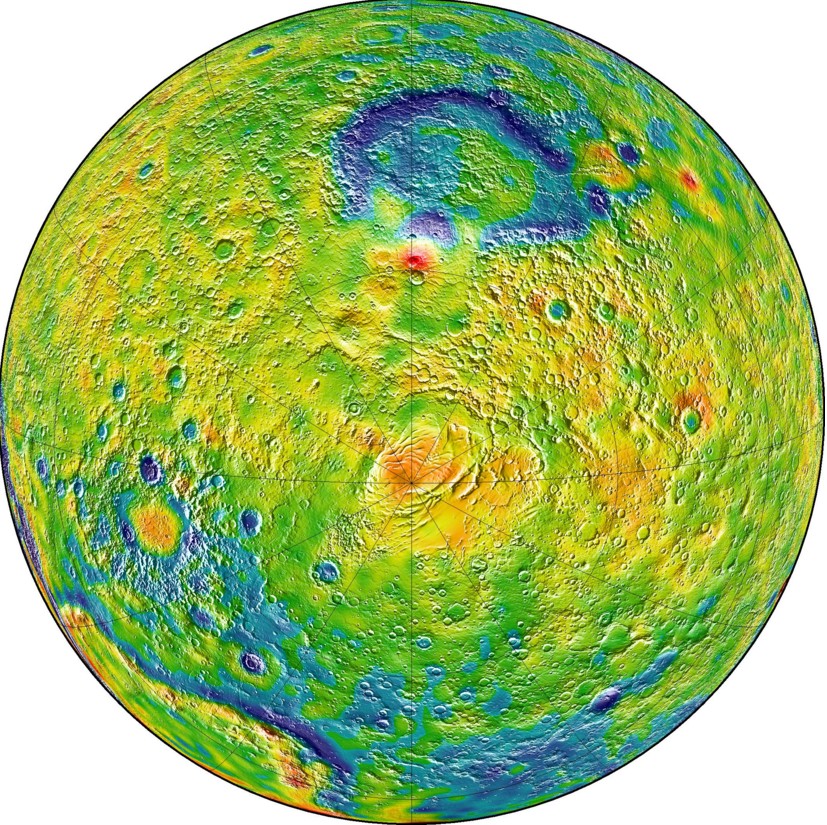
A map of Martian gravity looking down at the South Pole (center). White and red are areas of higher gravity; blue indicates areas of lower gravity. Credit: MIT/UMBC-CRESST/GSFC
New Mars' gravity map: high-resolution images and videos
The Watchers team and our contributors bring the latest on extreme weather, earthquakes, volcanic eruptions, space weather, and all things science. We're all about making sense of the natural world and keeping you informed on what’s happening. Got a tip or a question? Hit us up using the form at newstips!
Commenting rules and guidelines
We value the thoughts and opinions of our readers and welcome healthy discussions on our website. In order to maintain a respectful and positive community, we ask that all commenters follow these rules.