
2014 ozone hole update
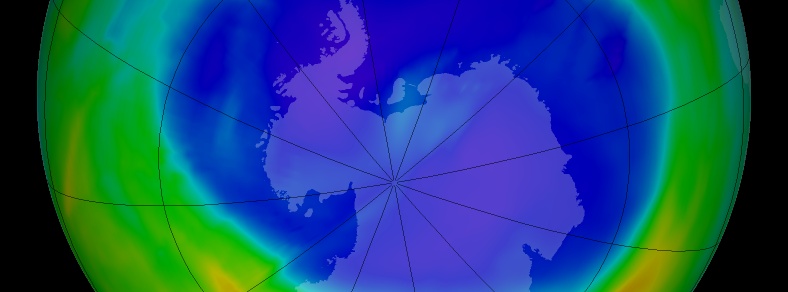
Image credit: NASA
According to scientists from NASA and NOAA, the Antarctic ozone hole reached its annual peak on September 11 with the size of 24.1 million square kilometers (93 million square miles). Overall, the 2014 ozone hole is smaller than the large holes of the 1998–2006 period, and is comparable to 2010, 2012, and 2013.
The single-day maximum area was similar to that in 2013, which reached 24.0 million square kilometers (9.3 million square miles). The largest single-day ozone hole ever recorded by satellite was 29.9 million square kilometers (11.5 million square miles) on September 9, 2000.
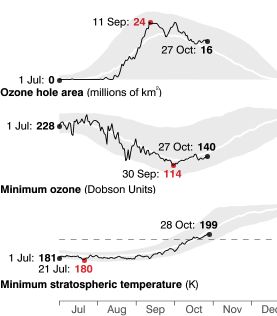
The graphs above show the progress of the 2014 ozone hole. The gray shading indicates the highest and lowest values measured since 1979. The red numbers are the maximum or minimum observed values. The stratospheric temperature and the amount of sunlight reaching the south polar region control the depth and size of the Antarctic ozone hole. Image credit: NASA/GSFC
With the increased atmospheric chlorine levels present since the 1980s, the Antarctic ozone hole forms and expands during the Southern Hemisphere spring (August and September). The ozone layer helps shield life on Earth from potentially harmful ultraviolet radiation that can cause skin cancer and damage plants.
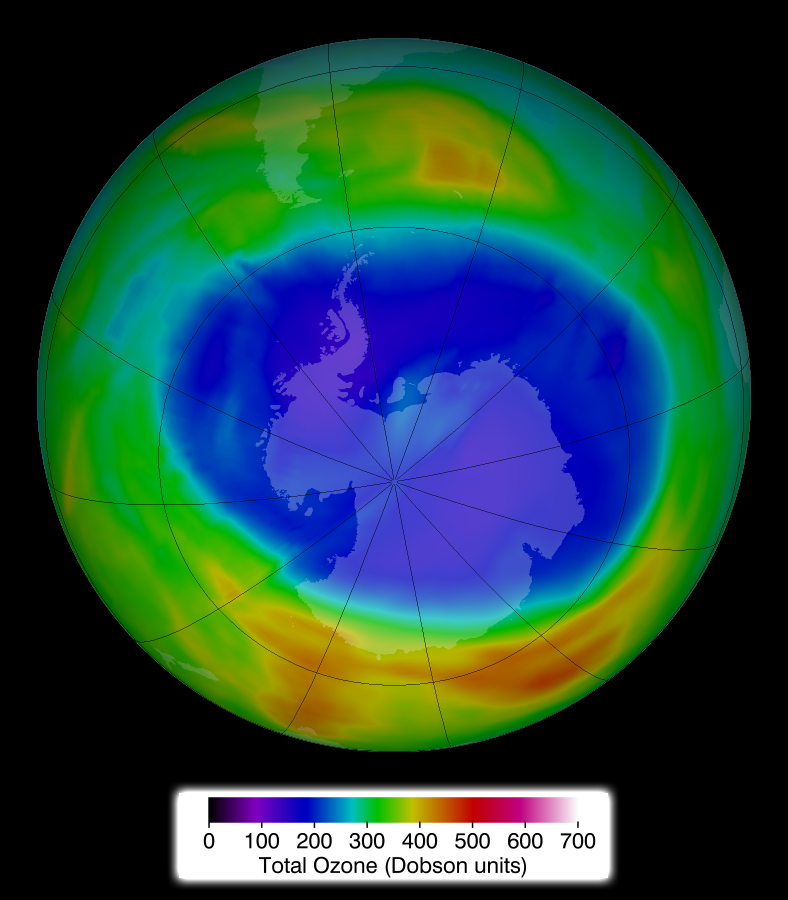
This image shows ozone concentrations above Antarctica on September 11, 2014. Image credit: NASA. See also NASA's Ozone Hole Watch website
Scientists are working to determine if the ozone hole trend over the last decade is a result of temperature increases or chlorine declines. An increase of stratospheric temperature over Antarctica would decrease the ozone hole’s area. Satellite and ground-based measurements show that chlorine levels are declining, but stratospheric temperature analyses in that region are less reliable for determining long-term trends.
Scientists also found that the minimum thickness of ozone layer this year was recorded at 114 Dobson units on September 30, compared to 250-350 Dobson units during the 1960s.
Over the last 50 years satellite and ground-based records over Antarctica show ozone column amounts ranging from 100 to 400 Dobson units, which translates to about 1 millimeter (1/25 inch) to 5 millimeters (1/6 inch) of ozone in a layer if all of the ozone were brought down to the surface.
The ozone data come from the Dutch-Finnish Ozone Monitoring Instrument on NASA’s Aura satellite and the Ozone Monitoring and Profiler Suite instrument on the NASA-NOAA Suomi National Polar-orbiting Partnership satellite. NOAA measurements at South Pole station monitor the ozone layer above that location by means of Dobson spectrophotometer and regular ozone-sonde balloon launches that record the thickness of the ozone layer and its vertical distribution. Chlorine amounts are estimated using NOAA and NASA ground measurements and observations from the Microwave Limb Sounder aboard NASA’s Aura satellite. (NASA)
Commenting rules and guidelines
We value the thoughts and opinions of our readers and welcome healthy discussions on our website. In order to maintain a respectful and positive community, we ask that all commenters follow these rules.