
Time-series of dome and glacier growth at Mount St. Helens (2004-2012)
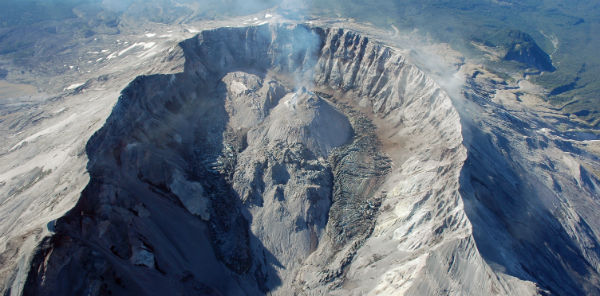
Image credit: Mount St. Helens' crater, dome, and the crater glacier, as seen from the north. The west arm of the crater glacier is nicely visible on the right of the dome. The east arm is in the shadow on the left of the dome.USGS Photograph taken on September 12, 2006, by Willie Scott
The video bellow shows time-lapse changes in the lava dome and Crater Glacier from 2004-2012.
The images were created from 1:12,000 scale vertical aerial photographs combined with ground control points from campaign GPS and targets. Photogrammetry software was used to collect a 3-D point cloud and combined to make a digital elevation model (DEM). Information regarding volume and rates of growth of the lava dome and glacier are extracted from DEMs to monitor surface changes in the crater.
Video Producer: Liz Westby , U.S. Geological Survey- CVO
Visit the CVO's webpage to learn more about the 2004-2008 eruption and Crater Glacier
Source: USGS
Its amazing how volcanoes grow, you dont see it or feel it, but its amazing to see a motion picture as they grow
Like THOR looking at Earth! wow!