
Recent advancements in mapping the world’s oceans
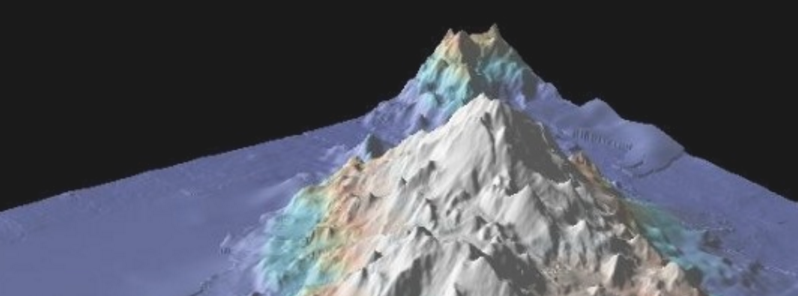
Featured image: Undersea mountains near the Hawaiian Islands. Images of the mountains and nearby seafloor are derived from sonar readings taken along the paths sailed by research ships. Image credit: The Marine Geoscience Data System
The scientists at Lamont-Doherty Earth Observatory, New York, have gathered data from hundreds of research cruises and made a significant contribution to providing easily accessible ocean floor maps to interested people across the globe.
The mapping site is capable of finding a location of particular interest, zooming in and providing a user with a topographical map of the ocean floor at the site. Seafloor maps can have resolutions up to 25 m (82 feet). Data gathered by the Lamont scientists has also contributed to the latest version of Google ocean map.
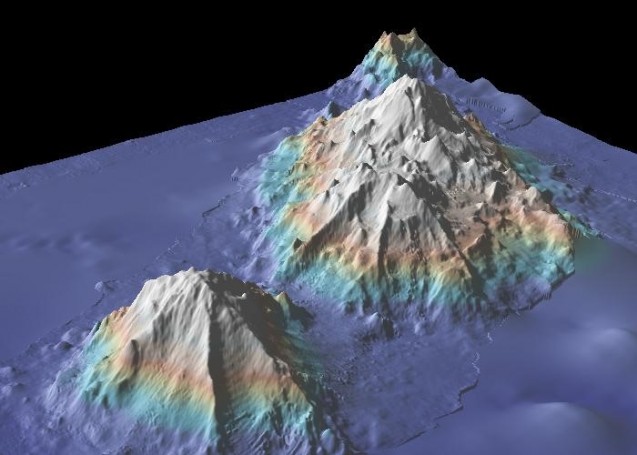
Undersea mountains near the Hawaiian Islands. Images of the mountains and nearby seafloor are derived from sonar readings taken along the paths sailed by research ships. Image credit: The Marine Geoscience Data System
The Google ocean map covers the entire seafloor and mostly uses satellite data, curated by the Scripps Institution of Oceanography, in partnership with NOAA, the US Navy, and the National Geospatial Intelligence Agency. Contributions are also made by the Japan Agency for Marine-Earth Science and Technology and Australia Geosciences (AGSO). More precise data from Lamont-Doherty Observatory has also been incorporated.
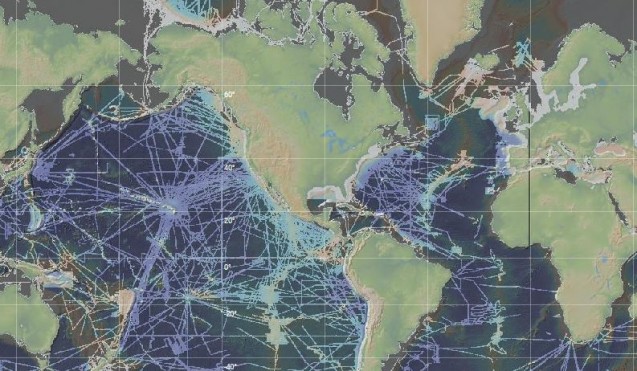 A map showing the tracks of research vessels where more detailed imagery of the seafloor is available. Image credit: The Marine Geoscience Data System
"I love looking at everything," said Vicki Ferrini, a scientist at Lamont a self-professed map and data geek who says she has her own map of the oceans in her head.
"I really like these sinuous channels in the deep sea, they’re very cool to me. … There [are] clearly concentrated areas of energy that are able to scour these river-like features through the seafloor. And the [mid-ocean] ridges are all pretty cool."
The data has been gathered from sonar devices that send a sound pulse through the water column, and use the sound speed and return time of an echo to determine depth. New data from Lamont covers approximately only 8% of the seafloor, and it has taken hundreds of cruises and millions of miles to gather it.
Thorough mapping of Earth's ocean floor would take between 125 and 200 ship-years of cruises. The maps are being updated by the Lamont team every six months.
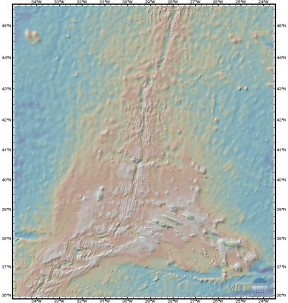 Details along the mid-Atlantic ridge. Image credit: The Marine Geoscience Data System
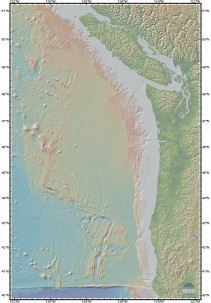 The seafloor off the northwest coast of the United States and southwest Canada. Image credit: The Marine Geoscience Data System
Data from satellite observations can show small changes in the height of sea surface which can, through gravity, reflect the underlying seafloor topography. The latest version of the Scripps-NOAA ocean map has a resolution of about 500 m (1 640.4 feet) while the earlier version provided only 1 km (3 280.8 feet) resolution.
"The coarse data does a beautiful job revealing the detailed boundaries of earth’s tectonic plates and other large-scale seafloor structures, and the map covers the entire ocean," said Suzanne Carbotte, a professor of marine geology and geophysics at Lamont-Doherty Observatory.
Conducted research has allowed the scientists to uncover a new “microplate” in the Indian Ocean, a remnant from the crustal shifts that sent the Indian subcontinent crashing into Eurasia, creating (and still forming) the Himalaya mountains. The scientists have been able to determine a more precise date of the beginning of the collision and estimate to 47.3 million years ago.
New maps provided by Lamont offer a much finer resolution and thus offers the scientist new investigation possibilities such as studying the active modern processes responsible for shaping up the seafloor, like earthquakes and undersea landslides.
Some of the more interesting geological features that also require further study include the deep ocean trenches, the fault lines where earth's crust is forming and deforming and massive oceanic plateaus and undersea volcanoes reflecting volcanic outpourings away from the mid-ocean ridges.
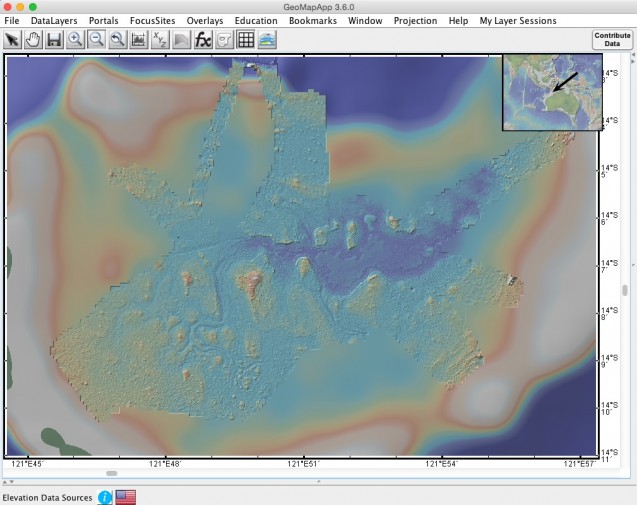 Multibeam sonar readings from the R/V Falkor opened up the details of Scott Reef, off the west coast of Australia, to view at about a 10 m resolution. Image credit: GeoMapApp
Researchers expect to find a lot of activity along the edges of tectonic plates and at subduction zones, as well. New mapping results have also helped scientists to see the geological activity in the broad interior spaces of the oceanic plates, such as volcanic seamounts fields and channels of sediments transported into the deep ocean.
“With the new detailed data from many subduction zones, we can conduct comparative studies of this bend faulting and relationships to the rate of subduction, the age of the plate and sediment cover, and [that] helps us in … understanding the subduction process,” Carbotte says.
Lamont-Doherty Observatory is well known for collecting ocean data for more than half a century. Famous oceanographers Marie Tharp and Bruce Heezen created the first comprehensive map of the global ocean in 1977, while, during the 1980s, William Haxby, another Lamont scientist used satellite measurements to produce the first "gravity field" ocean map.
"We have map displays at our seats that show the flight paths, and it used to be the ocean was just a single flat, featureless blue. Now they make use of these new ocean floor maps, so when you’re flying across the middle of the Atlantic, you can see the mid-ocean ridge right from your airplane seat," Carbotte said.
Commenting rules and guidelines
We value the thoughts and opinions of our readers and welcome healthy discussions on our website. In order to maintain a respectful and positive community, we ask that all commenters follow these rules.