
World earthquakes visualization map 2012-2013
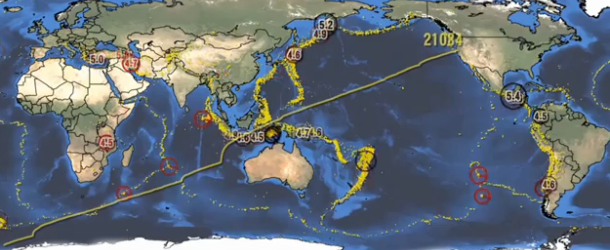
Image credit: TW
World Earthquakes Visualization Map shows animation of earthquake activity from January 2012 until May 2013.
Worldwide Earthquakes of 2012. All recorded earthquakes greater than magnitude 4.0 are shown for the full year, along with their depths and magnitudes. Locations of the world’s tectonic plates and the Ring of Fire are also depicted.
Credit: Monoroch/EQForecaster, PanglossTech
very interesting presentation nice background music