
Solar Dynamics Observatory: Three Years of Sun in Three Minutes
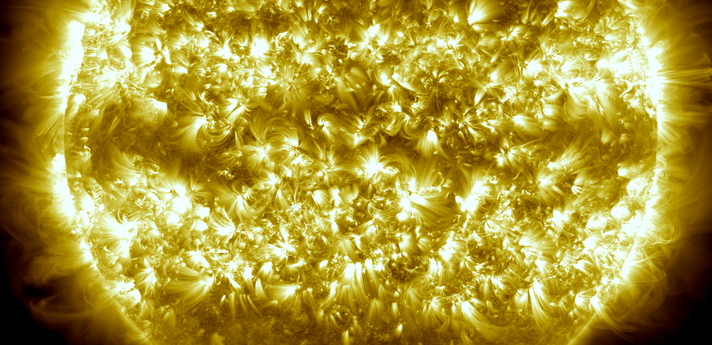
Featured image: This image, is a composite of 25 separate images spanning the period of April 16, 2012 to April 15, 2013. It uses the SDO AIA wavelength of 171 Angstroms and reveals the zones on the sun where active regions are most common during this part of the solar cycle. This version maintains the original aspect ratio of the AIA instrument imagery. Credit: NASA's Goddard Space Flight Center/SDO/S. Wiessinger
In the three years since it first provided images of the sun in the spring of 2010, NASA’s Solar Dynamics Observatory (SDO) has had virtually unbroken coverage of the sun’s rise toward solar maximum, the peak of solar activity in its regular 11-year cycle. This video shows those three years of the sun at a pace of two images per day.
SDO’s Atmospheric Imaging Assembly (AIA) captures a shot of the sun every 12 seconds in 10 different wavelengths. The images shown here are based on a wavelength of 171 Angstroms, which is in the extreme ultraviolet range and shows solar material at around 600,000 Kelvin. In this wavelength it is easy to see the sun’s 25-day rotation as well as how solar activity has increased over three years.
During the course of the video, the sun subtly increases and decreases in apparent size. This is because the distance between the SDO spacecraft and the sun varies over time. The image is, however, remarkably consistent and stable despite the fact that SDO orbits the Earth at 6,876 miles per hour and the Earth orbits the sun at 67,062 miles per hour.
Such stability is crucial for scientists, who use SDO to learn more about our closest star. These images have regularly caught solar flares and coronal mass ejections in the act, types of space weather that can send radiation and solar material toward Earth and interfere with satellites in space. SDO’s glimpses into the violent dance on the sun help scientists understand what causes these giant explosions — with the hopes of some day improving our ability to predict this space weather.
There are several noteworthy events that appear briefly in this video. They include the two partial eclipses of the sun by the moon, two roll maneuvers, the largest flare of this solar cycle, comet Lovejoy, and the transit of Venus. The specific time for each event is listed below, but a sharp-eyed observer may see some while the video is playing.
00:30;24 Partial eclipse by the moon
00:31;16 Roll maneuver
01:11;02 August 9, 2011 X6.9 Flare, currently the largest of this solar cycle
01:28;07 Comet Lovejoy, December 15, 2011
01:42;29 Roll Maneuver
01:51;07 Transit of Venus, June 5, 2012
02:28;13 Partial eclipse by the moon
More information about this video, as well as full HD version of all four wavelengths and print-resolution stills are public domain and can be viewed and downloaded at: http://svs.gsfc.nasa.gov/vis/a010000/…
Video credit: NASA SDO
I'm a dedicated researcher, journalist, and editor at The Watchers. With over 20 years of experience in the media industry, I specialize in hard science news, focusing on extreme weather, seismic and volcanic activity, space weather, and astronomy, including near-Earth objects and planetary defense strategies. You can reach me at teo /at/ watchers.news.
Commenting rules and guidelines
We value the thoughts and opinions of our readers and welcome healthy discussions on our website. In order to maintain a respectful and positive community, we ask that all commenters follow these rules.