
WMO dubbed last year as disturbing sign of climate change
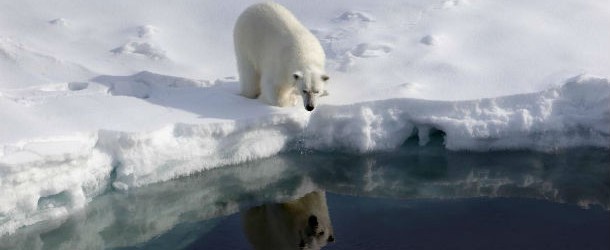
Image credit: GreenPeace
The World Meteorological Organisation revealed in Statement on the Status of the Global Climate, that during the August to September 2012 melting season, the Arctic’s sea ice cover was just 3.4 million square kilometres (1.32 million square miles). That is equal to 18% less than record low set in 2007. Last year was the ninth warmest year since recorded history and the 27th consecutive year that the global land and ocean temperatures were above the 1961–1990 average.
The 2012 global land and ocean surface temperature during January–December 2012 is estimated to be 0.45°C (±0.11°C) above the 1961–1990 average of 14.0°C. The years 2001–2012 were all among the top 13 warmest years on record. Last year’s warming came despite a cooling La Nina at the beginning of the year.
Above-average temperatures were observed across most of the globe’s land surface areas, most notably North America, southern Europe, western Russia, parts of northern Africa and southern South America while cooler than average conditions were observed across Alaska, parts of northern and eastern Australia, and central Asia.
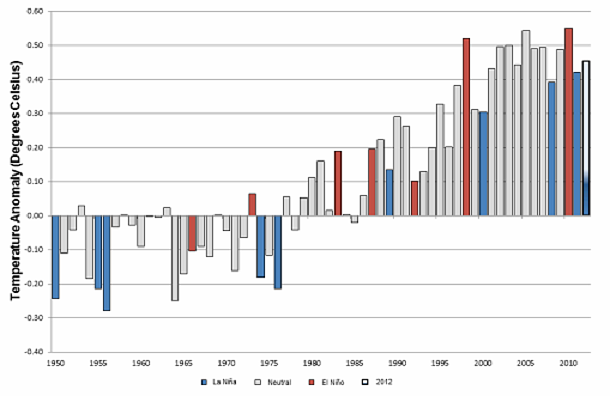
Global land and ocean surface temperature anomalies with respect to the 1961-1990 base period (Source: WMO)
Precipitation also varied, with drier-than-average conditions across much of the central United States, northern Mexico, northeastern Brazil, central Russia, and south-central Australia. Northern Europe, western Africa, north-central Argentina, western Alaska, and most of northern China were meanwhile wetter than average.
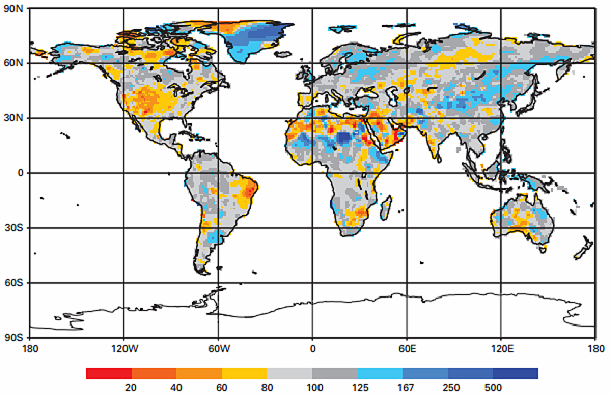
Annual precipitation anomalies for global land areas for 2012; gridded 1.0-degree rain gauge-based analysis as percentages of average focusing on the 1951–2000 base period (Source: Global Precipitation Climatology Centre, Deutscher Wetterdienst, Germany)
According to data from the Global Snow Laboratory, snow cover extent in North America during the 2011/2012 winter was below average. The previous two winters (2009/2010 and 2010/2011) had the largest and third largest snow cover extent, respectively, since records began in 1966.
On the other side, the Eurasian continent snow cover extent during the winter was above average, resulting in the fourth largest snow cover extent on record. Overall, the northern hemisphere snow cover extent was above average – 590000 km2 above the average of 45.2 million km2.
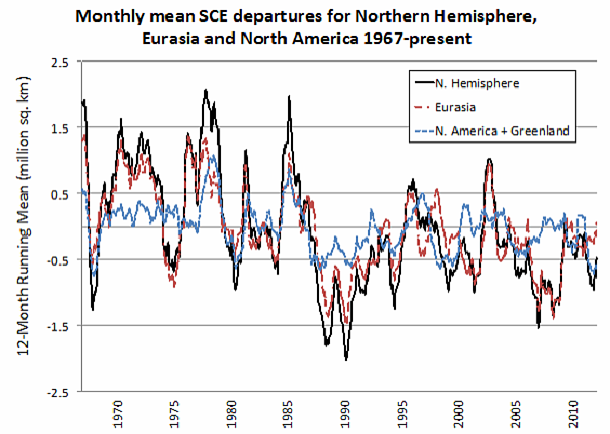
Twelve-month running anomalies of monthly snow cover extent over Northern Hemisphere lands (including Greenland) as a whole and Eurasia and North America separately between November 1966 and December 2012. Anomalies are calculated from NOAA snow maps. Mean hemispheric snow extent is 25.0 million sq. km for the full period of record. Monthly means for the period of record are used for 9 missing months between 1968 and 1971 in order to create a continuous series of running means. Missing months fall between June and October, no winter months are missing. (Credit: Rutgers University Climate Lab)
Nearly half of the surface of Greenland’s ice sheet melt naturally every summer but ice cover melted dramatically in July 2013, with an estimated 97 % of the ice sheet surface having thawed. This was the largest melt extent since satellite records began 34 years ago. A high-pressure system brought warmer-than-average conditions to Greenland, which are associated with the rapid melting, particularly across the lower elevations.
The difference between the maximum Arctic sea-ice extent (March 20, 2013) and the lowest minimum extent (September 16, 2013) was 11.83 million km2. Antarctic sea-ice extent in March was the fourth largest on record at 5.0 million km2 or 16 % above the 1979–2000 average. During its growth season, the Antarctic sea-ice extent reached its maximum extent since records began in 1979 , at 19.4 million km2.
According to statement, physical characteristics of extreme weather and climate events are being increasingly shaped by climate change. WMO Secretary-General Michel Jarraud dubbed it a “disturbing sign of climate change.” Jarraud also noted that the rate of warming varies from year to year due to a range of factors, including the El Nino and La Nina weather phenomena in the Pacific Ocean, as well as volcanic eruptions.
THE 10 MAJOR WEATHER AND CLIMATE EVENTS OF THE YEAR
• Global temperature continued to record positive anomalies; 2012 ranked among the 10 warmest years on record (base period: 1961–1990).
• Arctic sea ice continued its fast decline, reaching the lowest minimum sea-ice extent on record.
• Extreme heat affected Canada, the United States and Europe.
• Extreme drought conditions affected the United States and southeastern Europe.
• West Africa was severely hit by extreme flooding.
• The populations of Europe, northern Africa and northern Asia were acutely affected by extreme cold and snow conditions.
• Pakistan was affected by severe flooding for a third consecutive year.
• Hurricane Sandy, the costliest tropical cyclone of the year, ravaged the eastern seaboard of the United States.
• Typhoon Bopha, the deadliest tropical cyclone of the year, hit the Philippines in December.
• The polar ozone hole was the second smallest in the past 20 years.
The newly released statement points that the continued upward trend in atmospheric concentrations of greenhouse gases and the consequent increased radiative forcing of the Earth’s atmosphere confirm that the warming trend will continue.
In a summary of current climate change findings and figures, WMO experts point that:
- there is a strong scientific consensus that the global climate is changing and that human activity contributes significantly,
- human-induced climate change is caused by greenhouse gas emissions from industry, transport, agriculture and other vital economic sectors,
- atmospheric concentrations of the greenhouse gases that cause climate change continue to rise,
- global temperatures continue to climb,
- the Arctic is changing rapidly,
- sea levels are changing globally,
- recent trends in extreme events are consistent with the expected impacts of climate change.
The 2012 climate assessment, the most detailed to date, will inform discussion at WMO’s Executive Council meeting (15-23 May 2013).
WMO Information Note with a summary of current climate change findings and figures
Source: World Meteorological Organisation
I believe that Hansen (the Great Deceiver) has retired which has allowed NASA to publish their new study that proves that CO2 cools the atmosphere. This makes a complete mockery of all of the Climate Change Deceivers have ever done.
http://principia-scientific.org/supportnews/latest-news/163-new-discovery-nasa-study-proves-carbon-dioxide-cools-atmosphere.html#.UVYwRz4bXF4.facebook
Remember that the records that all of these so called climate scientists bang on about are only thirty or so years old. In climate terms that is nothing.
Here are some links to previous reports of arctic melting which show that if anything, it is a natural cycle.
http://paperspast.natlib.govt.nz/cgi-bin/paperspast?a=d&d=ST18730328.2.20
http://news.google.com/newspapers?id=PiohAAAAIBAJ&sjid=W34EAAAAIBAJ&pg=6753,466596&dq=arctic+ice+free&hl=en
http://trove.nla.gov.au/ndp/del/article/27078543?searchTerm=greenland%20ice%20melting&searchLimits
http://trove.nla.gov.au/ndp/del/article/9827111
http://trove.nla.gov.au/newspaper/result?q=greenland+ice+melting
Truth Of What Is Shortly Too Come
(” Some are now saying “)
(” Current estimates show that the global average sea level is likely to rise by up to 3 feet by 2100, which would cause significant flooding problems for coastal cities “)
This is immature and far from the truth more like ten times what is written above 30 feet + rise and long before 2100.
Many Scientist, Noble Scholars and others all have been studying this for a long time now.
Lately anyone who shows Light or Sings too Loud on the Truth Of What Is Shortly Too Come. Has a so called accident or is muzzled.
Scientist spotlight the world’s ice and how fast it is going vanishing. Scientist Giles and others have
noted through their studies most all ice on earth will be gone in the summers in the very
near coming years 10 to 20 the most. In many places on Earth the Ice that once was thousands of feet thick year round.
Scientist Dr. Katharine Giles was killed in a cycling collision in Victoria, London.
She is the second person from her UCL department to die in an so called accident.
Her death comes just three months after a senior colleague,
Prof Seymour Laxon, 49, died in a fall, hitting his head and suffering a
brain hemorrhage.
Scientist Dr. Giles had done many experiments investigating “Sea Ice Thickness”,
and showed to governments around the earth how the Sun rays and winds affected the newly exposed Arctic Ocean. Some of Scientist Dr. Giles research focused on using satellites to better understand the physics of the ice covered polar oceans.
Scientist Dr. Giles to all Warning Water will warm faster then ICE.
Dr. Giles and many other Scientist from around the Globe have been looking at Photos of before and after of the ice at the polls and Glaciers. Glacier Bay Alaska is a 60+ miles long fjord that once was a Glacier that was from Sea Level to top was over a thousand feet thick and over 60 miles long, gone for ever.
Scotland Yard’s report said the accident took place at the junction of
Palace Street and Victoria Street, near Victoria Station, at 8.25am on Monday.
Scientist Giles, from west London, was pronounced dead at the scene. The male driver of
the HGV lorry stopped at the scene. He was not arrested.
Any witnesses to this crime or INFO on it are asked to call the Road Death Investigation Unit at Catford, South-East London on
020 8285 1574. or Email it to many News Networks. Do both would be better.
The Lord’s Little Helper
Paul Felix Schott
PS
Planting Trees would Do More Good then spending more of the tax payers money on things most all with a brain already know of. Making the poor support the rich is wicked.
GOD Bless …. James E. Hansen and all …. that spotlight the truth.
Look at the Photo described below on the computer, the two below have been warning the world for many years.
Photo of The World’s Most Leading Authority on HYDROGEN Scientist Dr. Addison Bain and Young Scientist in training
Monica D. Key Lindbergh and the first Hydrogen car on Earth that Dr. Bain built for NASA.
Dr. Bain and Monica have been for years promoting Albert Einstein Dream, all on Earth will someday soon use Solar Energy.
I appreciate the facts and figures. The problem I see is this: scientific papers “suggest” that there “may” be a man-made aspect to global warming. Those with an agenda latch on to these studies as “proof” of their claims and kindle wild fires of fear to get the gullible to go along with their agenda.
How do these studies explain (or do they even attempt it?) the apparent warm period back in the 1200’s or so when the Vikings were settling Iceland and Greenland? We weren’t burning fossil fuels then. Perhaps there is yet another reason for the cycles we observe here on earth? I don’t know, maybe something to do with variations in the output of the sun?
CO2 Warmism denounced and Insurance Industry conference warned of Mini Ice Age events.
In his dynamic presentation – complete with globe and moveable Jet-Stream – to Sterling Insurance Industry “Claims Day” conference 17th April, Kings Hill, West Malling Kent, Piers Corbyn pointed-out the systematic failings and fraud of the CO2 warmist approach and argued the whole insurance industry needed to get to grips with Real Climate Change as now upon the world in the form of the developing Mini-Ice-Age.
Predictable Solar-Lunar factors drive weather & REAL climate change. Piers tells Insurers
Piers showed how the CO2-based Climate Change proposition was “delusional nonsense” which had failed in ALL its predictions and whose protagonists now “just make up explanations as they go along”. He specifically attacked Sir John Beddington’s recent ‘warm is cold’ cant on the BBC, pointing out:
1. There is no evidence in the real world for the CO2-driver proposition but that reality is the reverse and that world (sea) temperatures drive CO2 levels in the long run; and Sir John has been challenged (**VIDEOS below) to come up with evidence of his absurd claims.
2. If CO2 really did drive the recent Sea Ice changes and cold Spring which was in fact predicted well in advance in detail by WeatherAction’s Solar-Lunar based theory then it must be the case that mankind’s trivial contribution to levels of the trace gas CO2 are driving solar events (which were also predicted by WeatherAction) – which is absurd beyond belief!
On the Association of British Insurers (ABI) continuing adoption of Global Warmist assertions Piers pointed out that the current CO2-Warmist expectation of more and worsening summer floods and ‘warm makes cold’ snowy events came from the same people who predicted ongoing droughts, barbecue summers, ‘runaway warming’ and the end of snow in UK by 2010. “They just make it up”, said Piers, “and only now say these things because that is what is happening to the weather while CO2 still rises. They are misleading the Insurance industry, the economy and country and the ABI must reject the CO2 delusionism and adopt scientific Solar-lunar based Real Climate Change predictions”.