
Is Japan going to sink? pt.2
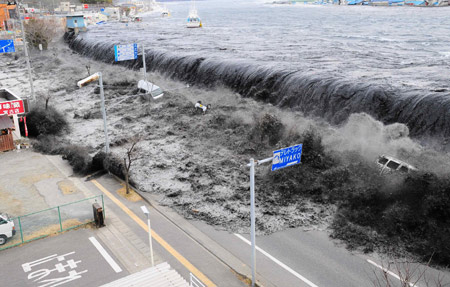
Image credit: TW
We would like to point out some observations of tsunami flooded areas after devastating 9.0 magnitude earthquake that hit Japan a week ago. We bring you some amazing satellite images that show areas affected by tsunami – before and after.
You can compare the impact and strength of the waves that flooded the areas. If we take the facts that coast of Japan sank for 1.2 meters and moved horizontally 5.3 meters then we can make some conclusions. It's not only tsunami that flooded the coastline but the mass land sinking as well. For now, in this part 2 of our analysis and hypothesis that Japan could really submerge eventually we will observe the current situation regarding the mass land loss affected by waters of ocean. For now, let's just observe some satellite imagery.
These images were taken by the ASTER instrument on NASA’s Terra satellite before and after the disaster. The disaster zone is still bombarded with aftershocks, which are expected to continue for many weeks, possibly months. About 340 significant aftershocks above magnitude 5 have swarmed the region since the 9.0 earthquake struck exactly a week ago.


The city of Rikuzentakata in Japan’s Iwate prefecture was almost entirely obliterated after the megaquake and deadly tsunami.


The deadly tsunami that inundated vast coastal areas along the eastern seaboard of the country’s main island flooded croplands and settlements along the Kitakami River.


The city of Ishinomaki was one of the worst hit areas when the deadly tsunami struck on March 11, 2011.

The extent of inundation from the destructive and deadly tsunami triggered by the earthquake centered off Japan’s northeastern coast about 130 kilometers (82 miles) east of the city of Sendai is revealed in this image pair from the Multi-angle Imaging SpectroRadiometer (MISR) instrument on NASA’s Terra spacecraft.
The new image, shown on the right, was acquired on March 12, 2011 during Terra orbit 59731. Images extend from just north of the Abukuma River (which is about 21 kilometers, or 13 miles, south of Sendai) to south of the town of Minamisoma (about 70 kilometers, or 44 miles, south of Sendai), and covers an area of 78 kilometers (48 miles) by 104 kilometers (65 miles). Flooding extending more than 4 kilometers (2.5 miles) inland from the eastern shoreline is visible in the post-earthquake image. The white sand beaches visible in the pre-earthquake view are now covered by water and can no longer be seen. Among the locations where severe flooding is visible is the area around Matsukawa-ura Bay, located just north and east of the image center. These unique images enhance the presence of water in two ways. (Image Credit:NASA/GSFC/LaRC/JPL, MISR)


These two images were made with a combination of infrared and visible light to enhance the contrast between land and water and they reveal extensive flooding along the coast. The Moderate Resolution Imaging Spectroradiometer (MODIS) acquired the top image of the Sendai region on February 26, 2011 and the lower image was taken March 12, 2011. Water is black or dark blue, plant-covered land is green, snow-covered areas are pale blue and paved areas in the city of Sendai is shown in brown.

A swath of agricultural fields lies between the city of Sendai and Sendai Bay. This area was one of the hardest hit by the tsunami. Days later, the fields nearest the ocean were still covered with standing water. On the outskirts of the Sendai suburbs, fields that had escaped inundation or had already drained were then covered with snow, as was the Sendai metropolitan area. The Advanced Land Imager (ALI) on NASA’s Earth Observing-1 (EO-1) satellite captured this natural-color image of the area on March 18, 2011.

The images show the coastal cities of Ofunato and Kesennuma, located about 90 kilometers (55 miles) northeast of Sendai. Areas covered by vegetation are shown in red, while cities and unvegetated areas are shown in shades of blue-gray. The image on the left was acquired on March 14, 2011; the image on the right was acquired in August 2008. When compared closely, vegetation is no longer visible in many coastal areas in the new image, particularly around Kesennuma. Scientists believe this is most likely due to the effects of the tsunami. The images show an area located at 39.4 degrees north latitude, 141.9 degrees east longitude, and cover an area of 28 by 46 kilometers (17 by 27 miles).
We found few more satellite images from GEOEYE and Google Earth showing mass land flooded by tsunami wave. The waters still remain and it could be possible that this is effect of sinking of coast for approximately 1,2 meters.


Expedition 26 crew member on board the International Space Station have snapped photos from orbit of the effects of the massive earthquake. The March 13 photo captured by the astronauts shows how the region north of the coastal city of Sendai appeared from the station's altitude of 220 miles (354 kilometers). The image shows Japan's Ishinomaki Bay, Naruse river and part of the city of Higashimatsushima. Flood water is rampant in the view.


Digital Globe released a good image of tsunami flooded area. At Minamisoma, prefecture of Fukushima, the tsunami came 1.5 miles inland.

German Optical RapidEye and radar TerraSAR-X satellites took the image of Torinoumi on the eastern coast of Japan and it's flooded area. Here you can see Rapideye imagery presentation in pdf format.
")
")
The satellite images are being used to map and assess the stricken areas. Japan's northwestern coastline is thought to have shifted by as much as 13 feet (4 meters) to the east, and whole towns have been washed away by the tsunami, completely changing the landscape. (Japan Disaster Recovery Efforts Get Help From [email protected])
In the report issued by Japan's Geospatial Information Advisory (GIS) on March 15, preliminary results showed that the main island of Japan moved by 2.4 meters (8 feet) and shifted the Earth on its axis. Reports from the National Institute of Geophysics and Volcanology in Italy estimated the earthquake shifted the planet on its axis by nearly 4 inches (10 centimeters).
The quake was the most powerful to hit the island nation in recorded history and the tsunami it unleashed traveled across the Pacific Ocean, triggering tsunami warnings and alerts for 50 countries and territories as far away as the western coasts of Canada, the U.S. and Chile. Some waves reached six miles (10 kilometers) inland in Miyagi Prefecture on Japan's east coast. The quake triggered more than 160 aftershocks in the first 24 hours – 141 measuring 5.0-magnitude or more.
The quake occurred as the Earth's crust ruptured along an area about 400 kilometers (250 miles) long by 160 kilometers (100 miles) wide, as tectonic plates slipped more than 18 meters, said Shengzao Chen, a USGS geophysicist. (GSI)
Center for Satellite based Crisis Information issued Tsunami Inundation Assessment Overview, a thematic map of impact area and collection of disaster extent maps (Sendai region, Toriniumi area, Miyagi, Soma…) You can also check TerraSAR-X Change Analysis of Sendai Area.
")
Geology In Motion tried to calculate the power of tsunami wave in the article called .These numbers may change by factors of ten as new data and rigorous analyses come in. (Details of this estimate technique can be found here)
The power of a tsunami is a measure of energy per unit time. It was first defined back in the steam ages in order to compare steam engines to working draft horses. There's an excellent review of this history on Wiki under "horsepower." The power of a tsunami is the rate at which the kinetic energy in the tsunami is transferred to the shoreline. If we follow the calculations of +Maths** and use data for Sri Lanka and the Sumatran earthquake, the power in a 1 meter high tsunami traveling at 200 m/s in the open ocean is about 1 megawatt per meter of shoreline, or 1 gigawatt per kilometer. We simply do not have data, or even know, if the waves that hit the northern part of Japan were traveling at this speed; we do know from the videos being posted on the WWW that they were higher than 1 meter over long distances. We don't know the exact amount of shoreline yet impacted on Honshu, but it appears that the northern Kanto and Tohoku provinces (yellow+green on the map above) were heavily hit on the Pacific side. From the map, we can estimate that about half of the coastline is on the Pacific side (2725 km), and that about 1/2 of that coastline was hit (yellow+green+ a bit), about 1300 km. (Note made as new stories come in–this length of shoreline may be on the high end.) This means that the power of the tsunami along that shoreline was about 1.3 *10^12, or 1.3 petawatts. To get energy, we need to know the duration of the tsunami. Let's estimate 100-1000 seconds. This means that the total energy was at least 1.3 * 10^14 joules, or 31 kilotons, equivalent to the 36 (15+21) kt that destroyed Hiroshima and Nagasaki, combined. If the duration was on the long end of these estimates, or the waves higher, this number could easily be 310 or even 3100 kilotons, equal to 10 or 100 Hiroshima's and Nagasaki's. My "gut feeling" from looking at the number of completely devastated cities is that these higher numbers are very likely. (How much power in the Japanese tsunami of 2011? How much energy? Equivalent to how many nuclear bombs?@Geology In Motion)
We found few amazing images showing the strength of tsunami waves:


Japan is located along the Pacific "ring of fire," an area of high seismic and volcanic activity stretching from New Zealand in the South Pacific up through Japan, across to Alaska and down the west coasts of North and South America. The quake was "hundreds of times larger" than the 2010 quake that ravaged Haiti according to Jim Gaherty of the LaMont-Doherty Earth Observatory at Columbia University.
The Japanese quake comes just weeks after a 6.3-magnitude earthquake struck Christchurch on February 22, toppling historic buildings and killing more than 150 people. The timeframe of the two quakes have raised questions whether the two incidents are related, but experts say the distance between the two incidents makes that unlikely. We think that those two earthquakes could be likely connected regarding the position of Pacific tectonic plate.
Commenting rules and guidelines
We value the thoughts and opinions of our readers and welcome healthy discussions on our website. In order to maintain a respectful and positive community, we ask that all commenters follow these rules.