
First-of-its-kind deep-Earth conductivity map reveals ancient continental fragments beneath the United States
A first-of-its-kind continent-scale conductivity map made using over 1 700 magnetotelluric stations deployed across the United States has revealed buried tectonic fragments beneath eastern North America, allowing researchers to reconstruct the continent’s deep electrical structure while exposing conductive regions linked to ancient continental collisions, mineral systems, and geomagnetic storm hazard propagation.

CONUS-MT-2026 model conductance integrated over depths of 5 to 40 km, highlighting interpreted lower-crustal conductive pathways associated with major tectonic structures and mineralized regions across the conterminous United States. Credit: Authors, AGU/Wiley
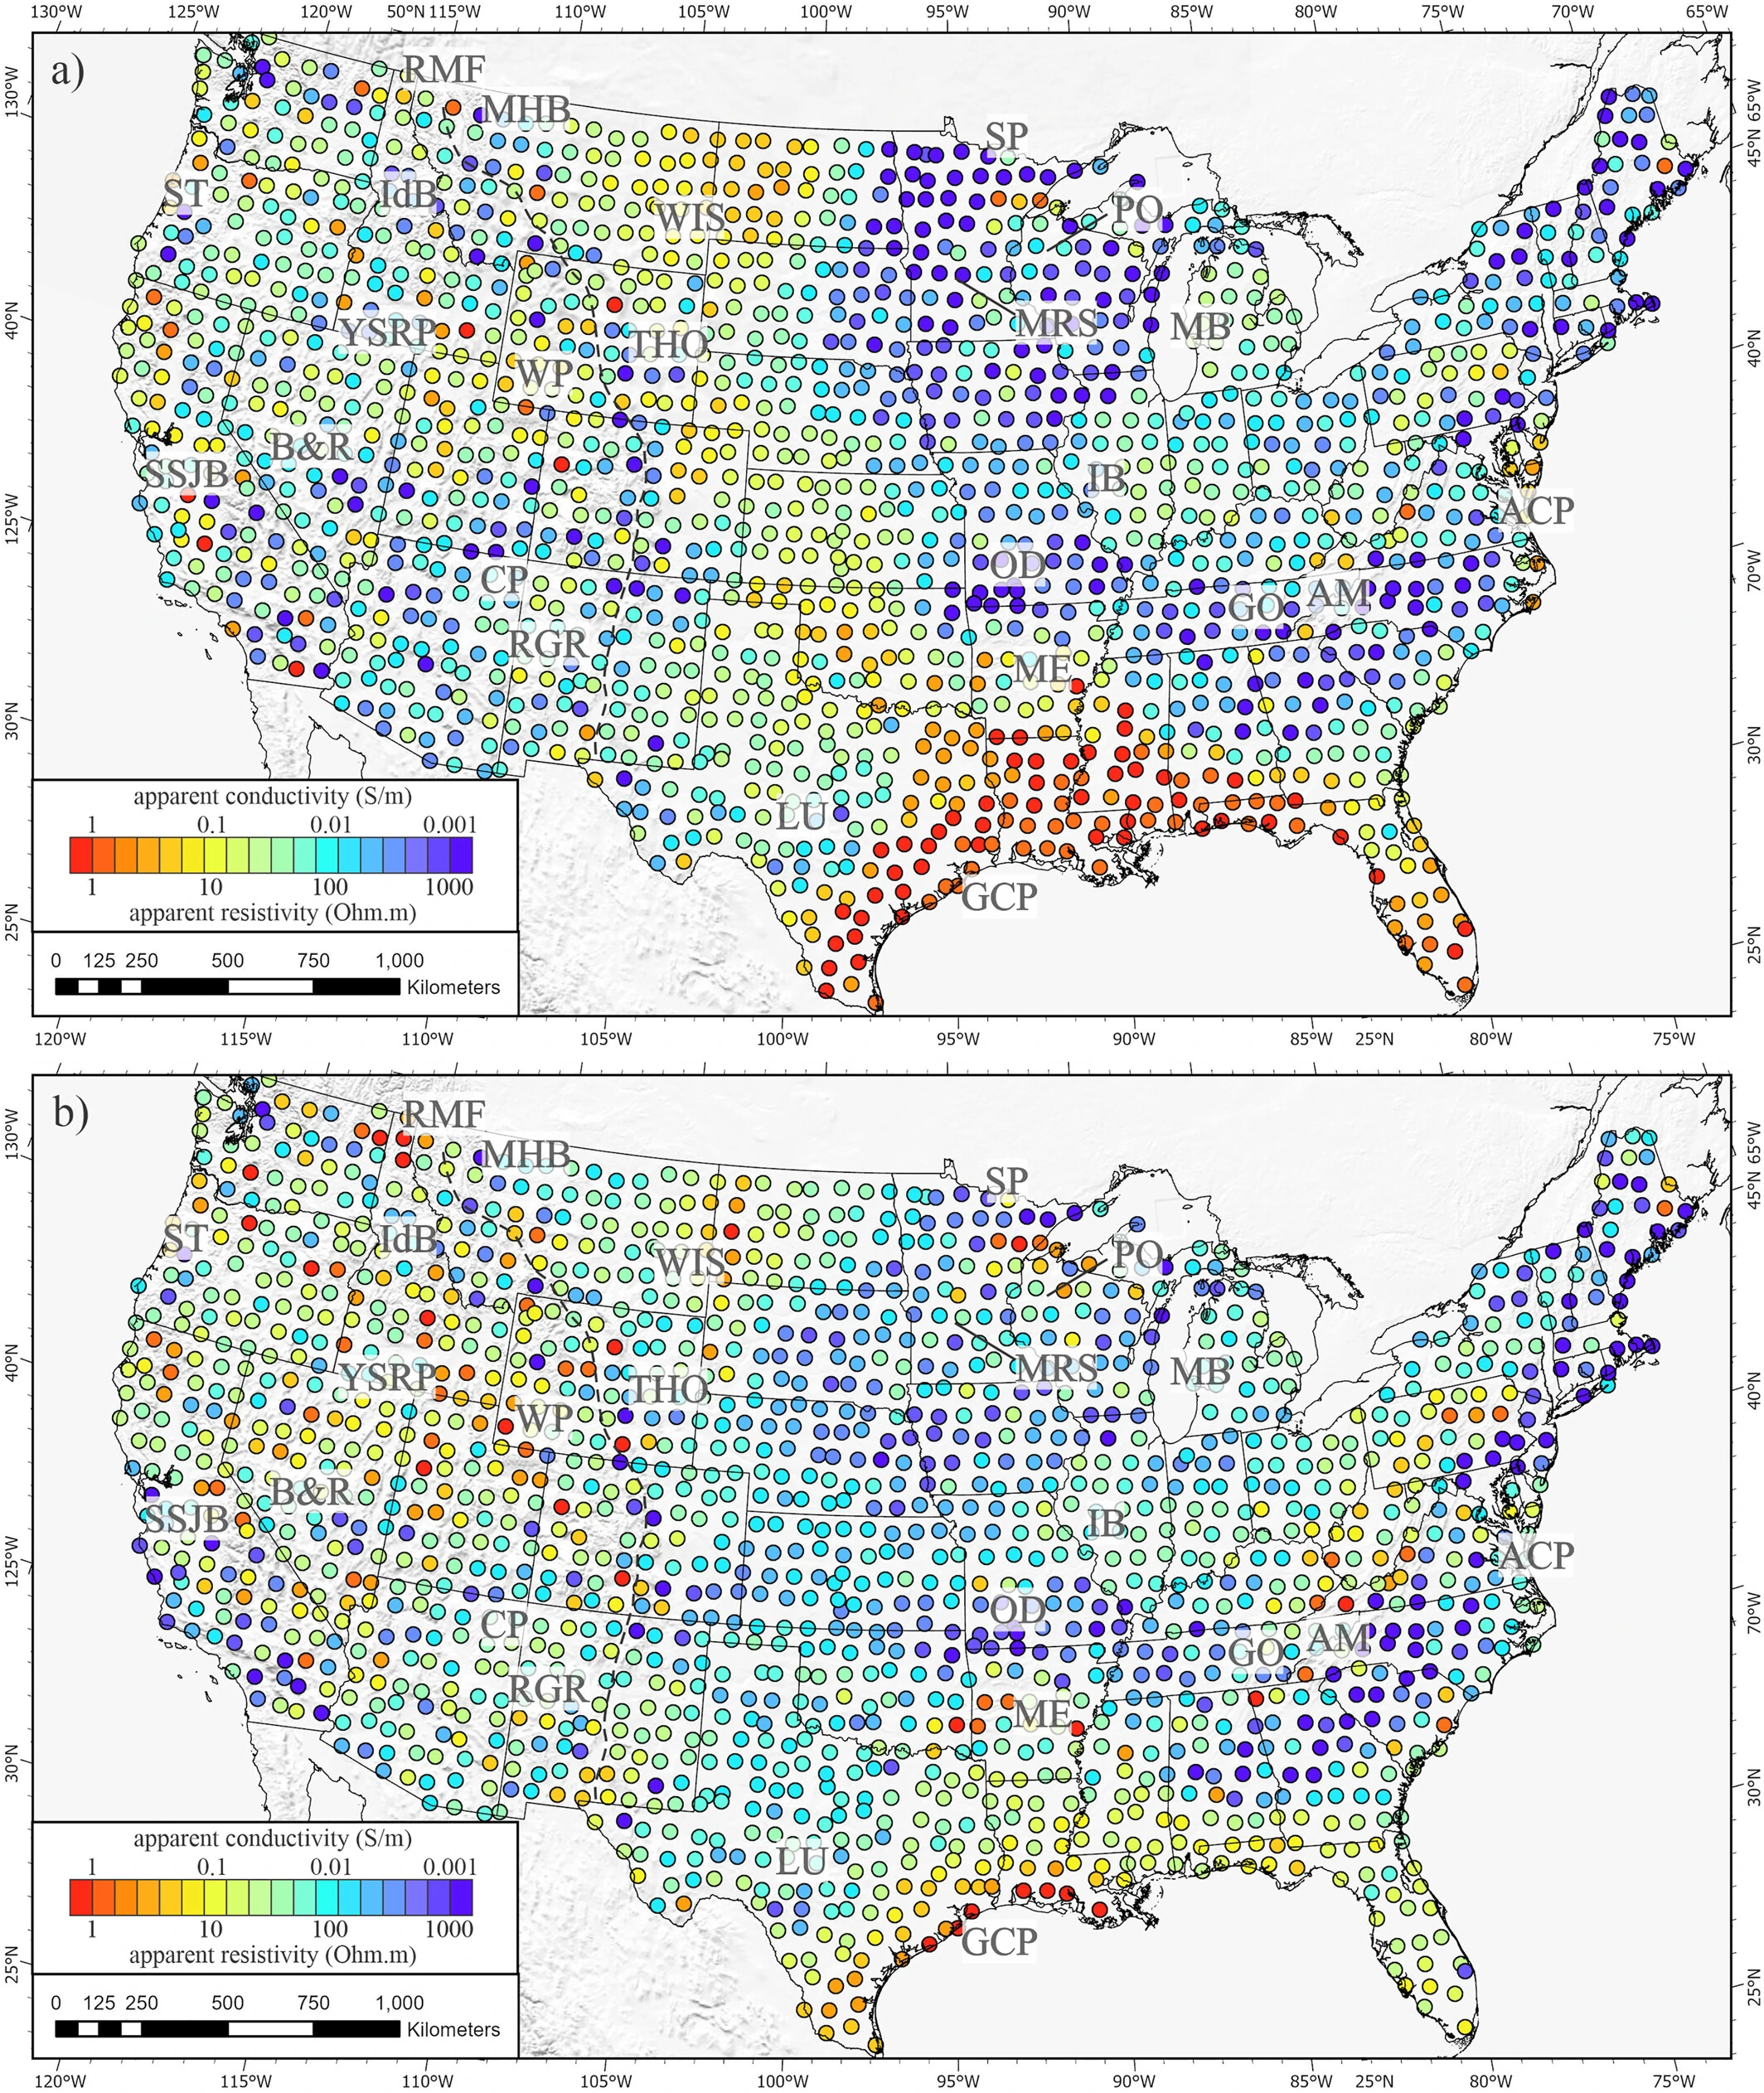
The project, known as the United States Magnetotelluric Array (USMTArray), collected long-period magnetotelluric measurements between 2006 and 2024 on an approximately 70 km (43 miles) grid spanning the contiguous United States.
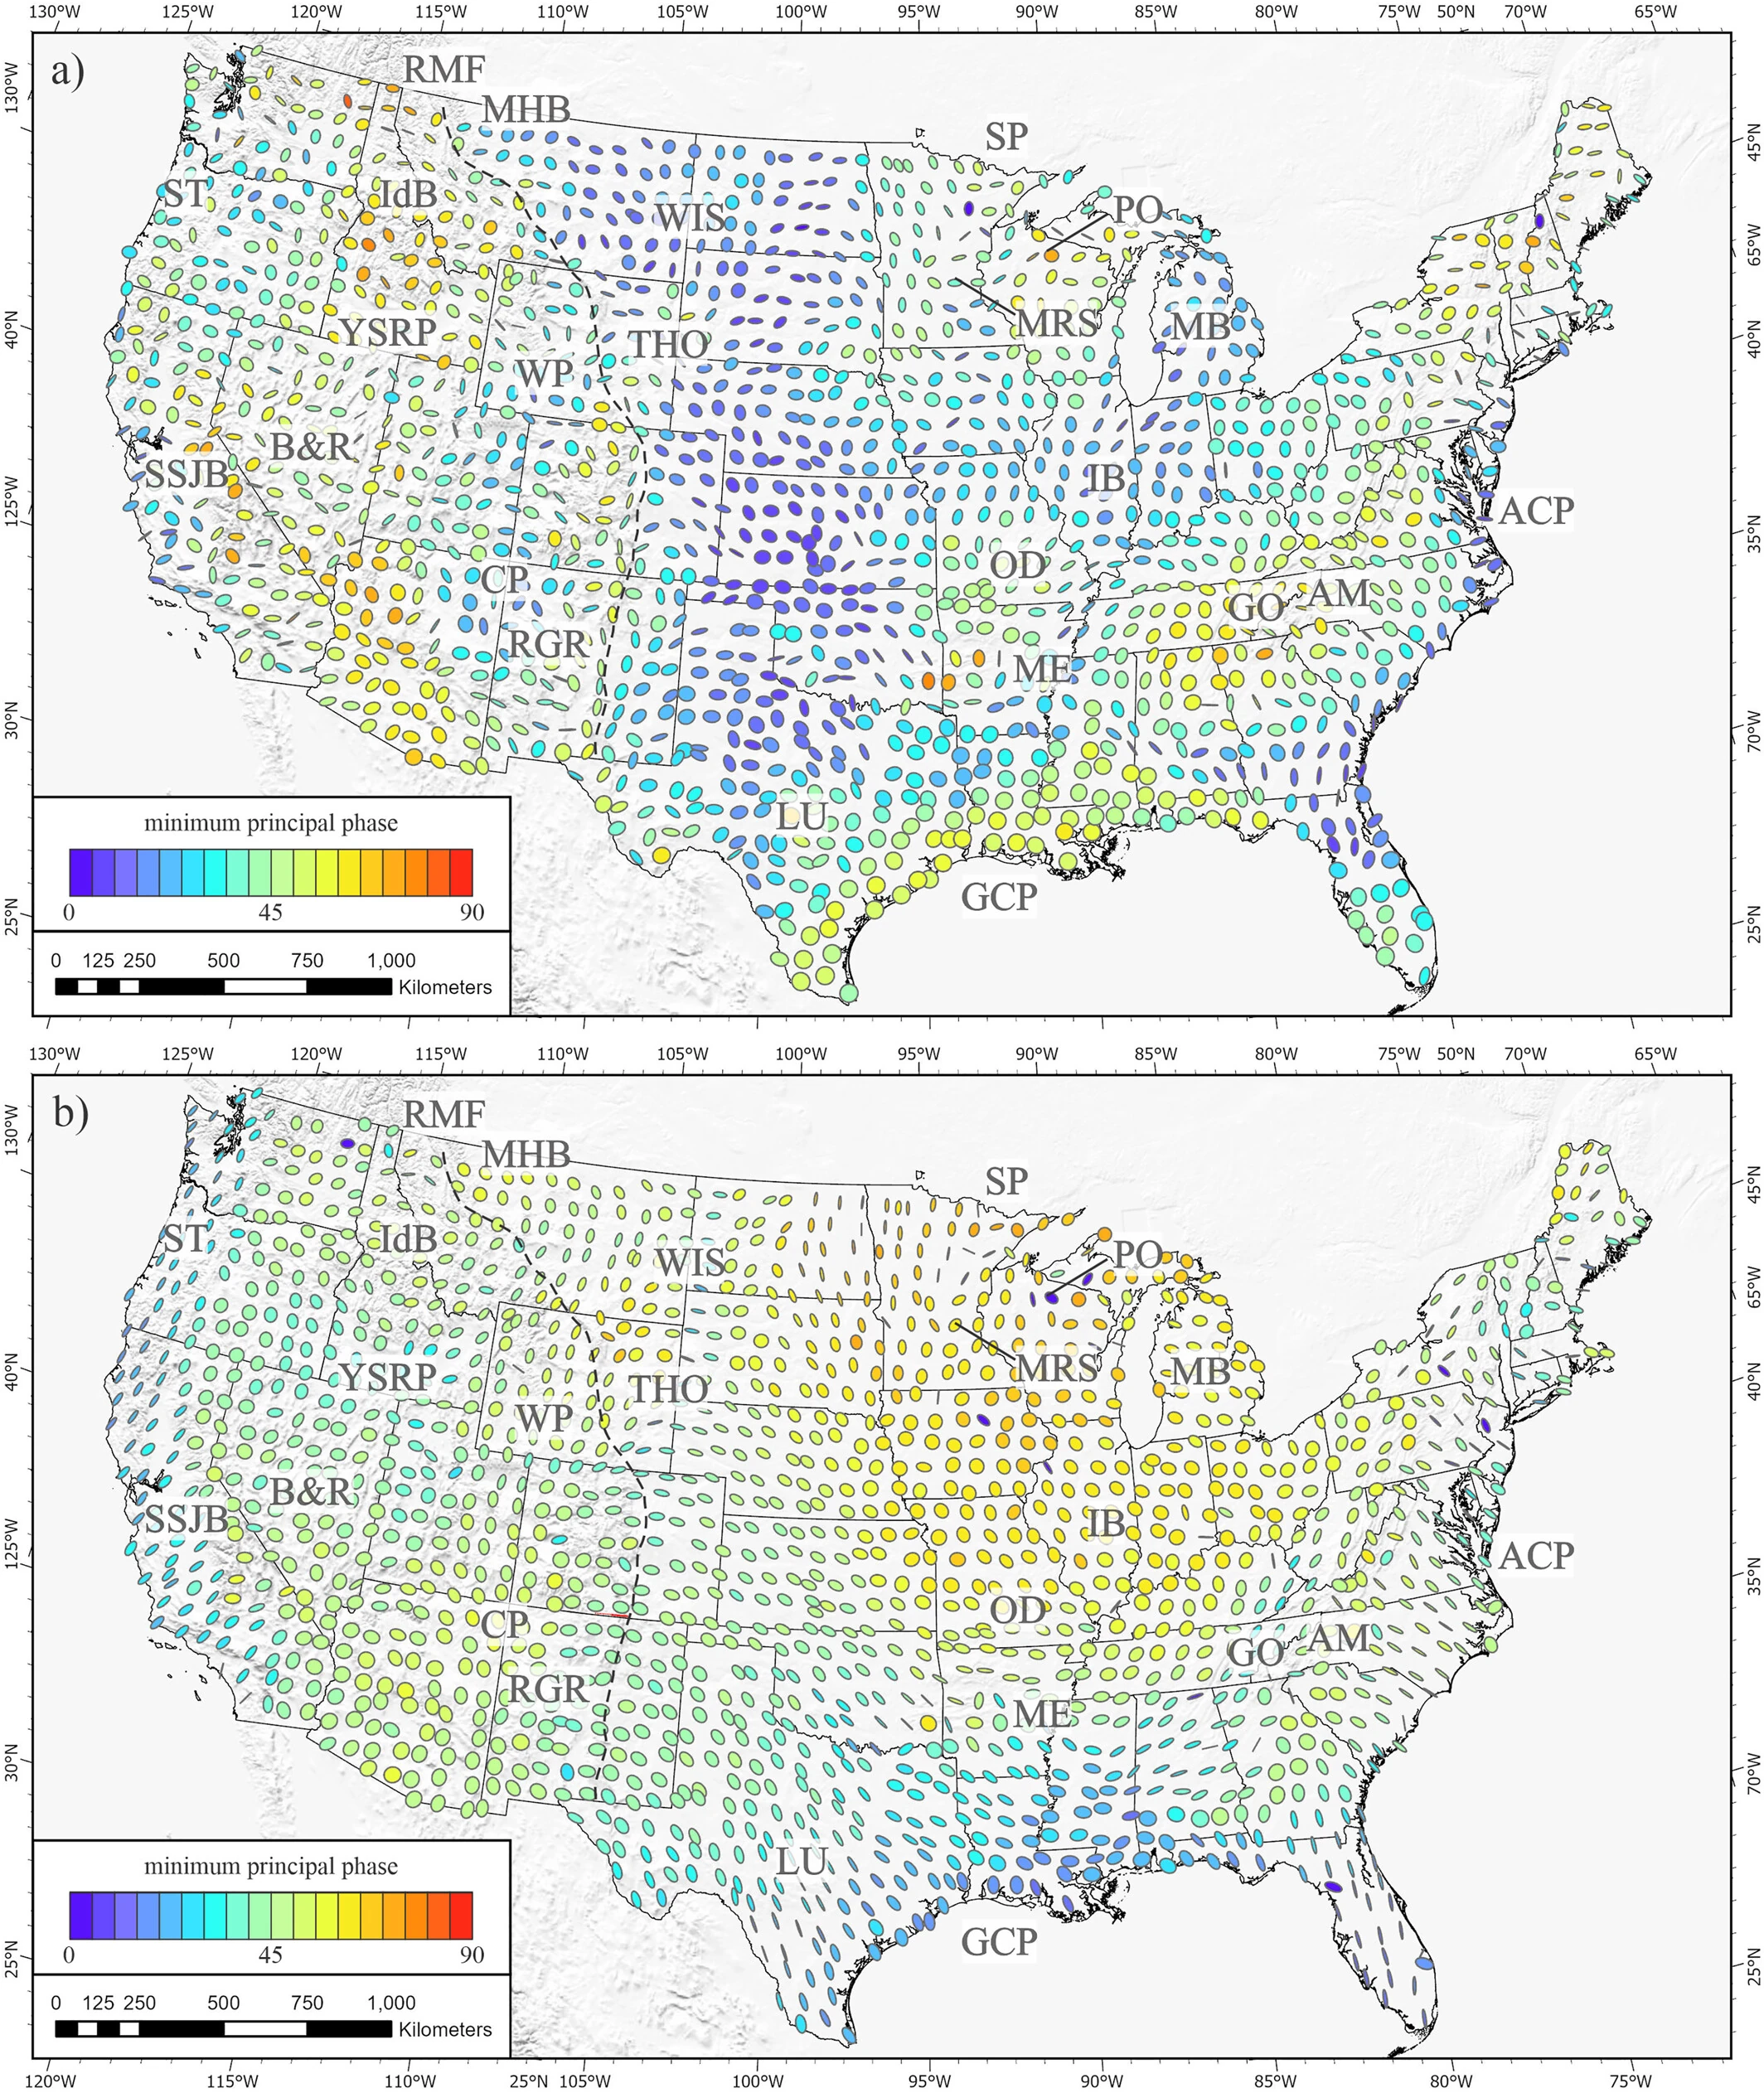
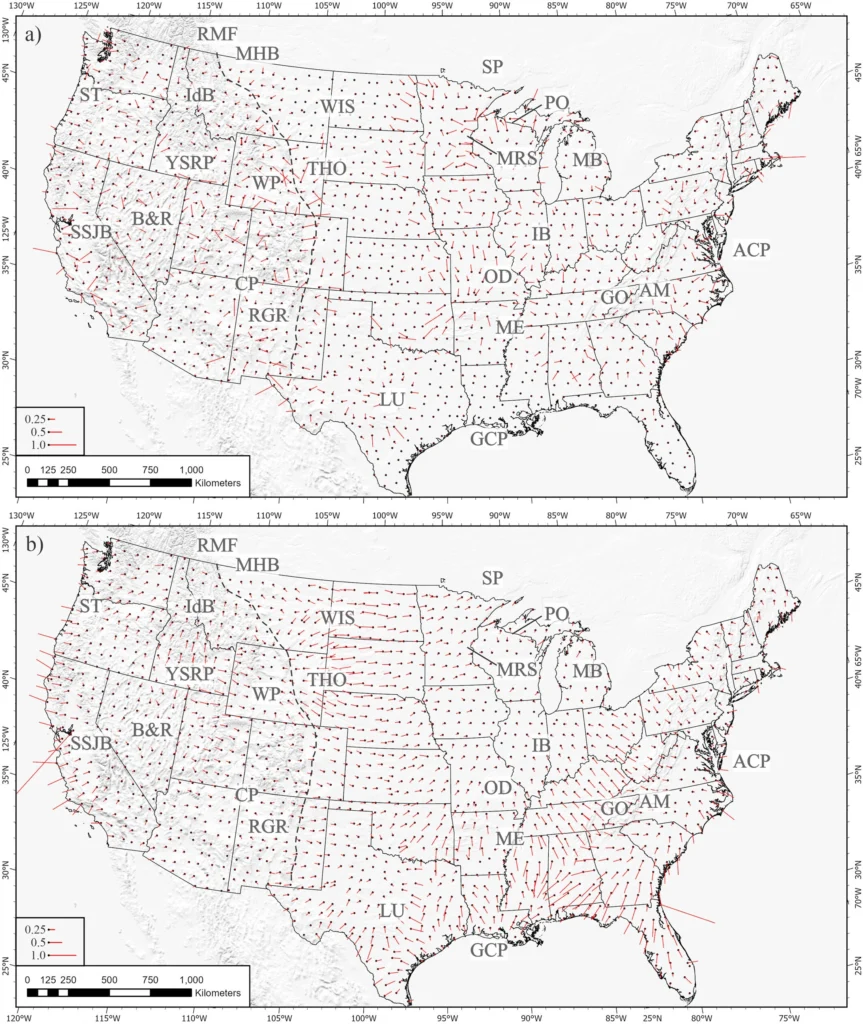
Researchers combined those measurements into the “National Impedance Map” and a continent-scale three-dimensional conductivity model imaging the electrical structure of the crust and upper mantle beneath North America.
The resulting conductivity patterns revealed buried tectonic boundaries and crustal fragments beneath the Appalachian region that researchers interpret as remnants of ancient continental collisions associated with the assembly of North America.
The structures formed during Paleozoic tectonic events that welded multiple terranes and continental blocks into the eastern margin of the continent.
The conductivity model was derived from magnetotellurics, a passive geophysical technique that uses natural electric and magnetic fields at the Earth’s surface, which come mainly from lightning and currents in the ionosphere and magnetosphere.
As these signals travel through the Earth, they are changed by materials that conduct or resist electricity. By measuring these changes, researchers can estimate how conductive the Earth is at different depths.
Different rock types and geological conditions conduct electricity differently. Conductivity generally increases in regions containing interconnected fluids, saline pore water, sulfide minerals, graphite-bearing rocks, elevated temperatures, or partial melt.
Regions that are more resistive commonly correspond to stable cratonic lithosphere or comparatively dry mantle material. Because conductivity responds strongly to fluids and mineral composition, magnetotelluric imaging can expose structures that remain less distinct in seismic datasets alone.
The completed survey is the first continental-scale magnetotelluric dataset of its kind in the United States. The array includes data from over 1 700 publicly available long-period stations collected through cooperation among the U.S. Geological Survey, the National Science Foundation EarthScope initiative, Oregon State University researchers, and multiple federal and academic partners.
The electrical structure model is useful for more than just understanding tectonic history. The electrical conductivity of the Earth’s crust and upper mantle affects how solar storms disrupt the Earth’s magnetic field.
These disruptions create electrical currents in the ground, which can then interfere with high-voltage power lines and other long pieces of infrastructure that conduct electricity. Therefore, mapping electrical conductivity helps improve models that assess the risks that solar storms pose to power grids.
The U.S. Geological Survey considers evaluating geomagnetic hazards a key goal of its national magnetotelluric mapping project. During intense geomagnetic storms, solar activity causes rapid changes in Earth’s magnetic field. These changes can create electrical currents in the ground, and the intensity and location of these currents depend on the ground’s conductivity.
Areas with significant differences in conductivity can experience very different electrical field responses during the same geomagnetic storm.
Researchers also found applications for geothermal exploration and critical mineral targeting. Conductive anomalies can indicate fluid-rich pathways, hydrothermal systems, sulfide mineralization, and lithospheric structures associated with ore formation. The conductivity survey therefore provides a framework for identifying regions favorable for undiscovered geothermal and mineral resources across the United States.
This project is the result of almost 20 years of geophysical surveys across the continent, starting with the NSF EarthScope initiative. The project grew from initial tests into a national system for observing the Earth. This system has broadened magnetotelluric research in the U.S. and created public datasets used by researchers globally.
The way electrical currents flow beneath eastern North America helps us better understand how the continent was formed. North America’s creation involved many events over millions of years, including landmasses colliding and sticking together, crust being added, sinking plates, and mountains rising. A map of electrical conductivity shows that traces of these old geological features still exist far below the surface, influencing the continent’s electrical properties deep down.
References:
1 Kelbert, A., Bedrosian, P. A., Schultz, A., Egbert, G. D., Pellerin, L., Love, J. J., et al. (2026). The United States Magnetotelluric Array and the National Impedance Map – Reviews of Geophysics – DOI: https://doi.org/10.1029/2024RG000850
2 Mapping the grid: The United States Magnetotelluric Array – USGS – March 17, 2026

I am an Assistant Editor and Severe Weather & Science Journalist at The Watchers, specializing in real-time severe weather coverage, geophysical event reporting, and research-driven scientific analysis. You can reach me at rishav(at)watchers(.)news.
Commenting rules and guidelines
We value the thoughts and opinions of our readers and welcome healthy discussions on our website. In order to maintain a respectful and positive community, we ask that all commenters follow these rules.