
A wave up to 3 m (10 feet) high rose out of Lake Michigan on a sunny June morning in 1954 and swept fishermen off Chicago’s piers, and when a second came 10 days later, warnings had cleared the shore
A meteotsunami about 3 m (10 feet) high struck Chicago’s Lake Michigan shoreline on June 26, 1954, sweeping fishermen from the Montrose Harbor piers and killing at least seven people. Another meteotsunami reached the city exactly 10 days later; warnings were issued before its arrival, and no fatalities were reported.
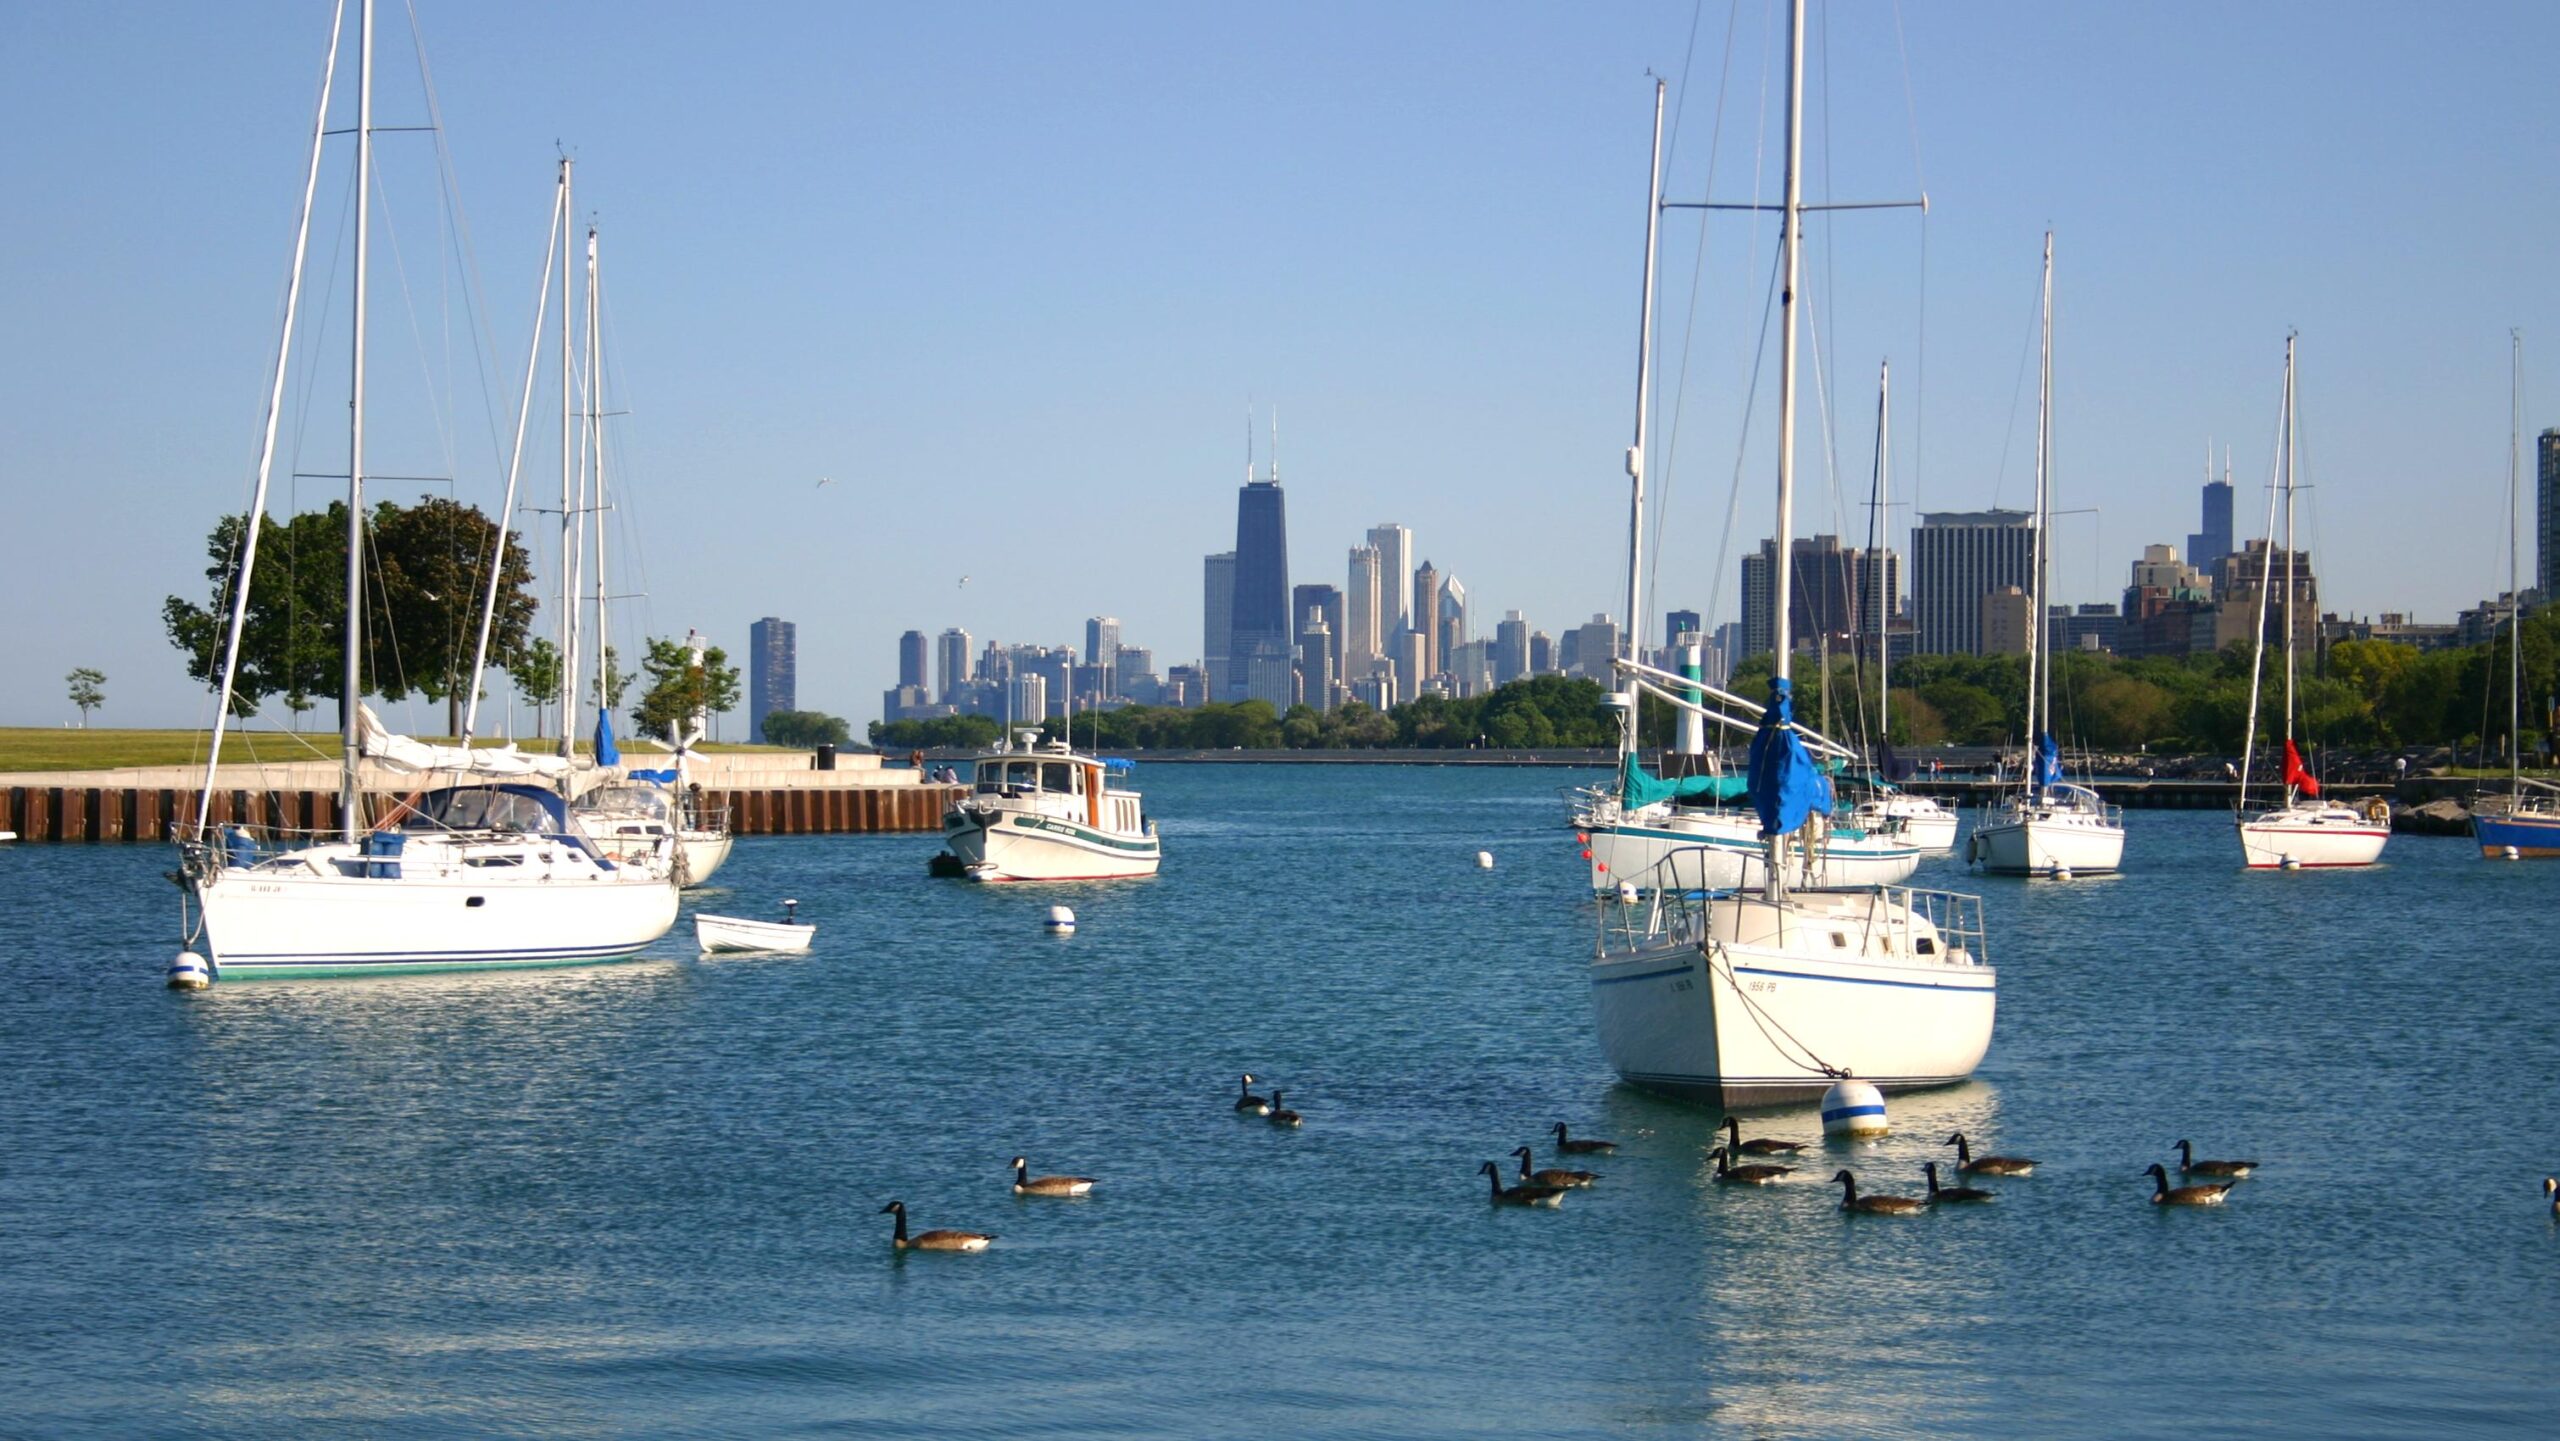
Montrose Harbor on Chicago's Lake Michigan shoreline. Fishermen on piers at the harbor were swept into the lake during the June 26, 1954 meteotsunami. This photograph was taken in 2006 and does not show the 1954 event. Credit: J. Crocker
Severe weather had crossed Lake Michigan roughly two hours before the June 26 wave reached Chicago, but NOAA reports that conditions were hot and sunny when the water struck the shoreline. Fishermen at Montrose Harbor were swept from the piers, while floodwater moved about 50 m (164 feet) inland. Residual oscillations and strong currents continued long after the main surge, interfering with rescue and recovery operations for about 34 hours.
The event occurred without an earthquake or other seismic trigger. Meteotsunamis are long water waves generated by rapid atmospheric disturbances, particularly changes in air pressure and wind associated with fast-moving weather systems. They can resemble seismic tsunamis in their periods, coastal run-up and strong currents even though their source is in the atmosphere rather than beneath the water.
Early scientific work treated the 1954 Chicago event as a seiche or surge within Lake Michigan. George W. Platzman investigated the June 26 event numerically in 1958, but subsequent measurements, atmospheric reconstructions and hydrodynamic modeling changed the interpretation of how the destructive wave developed.
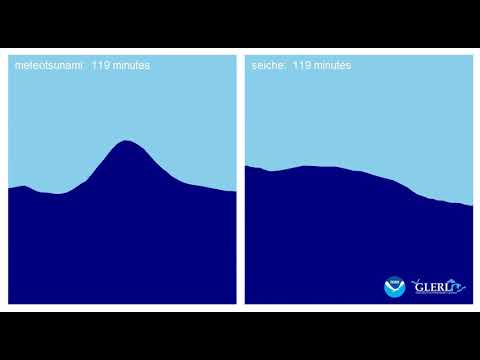
Adam Bechle and Chin Wu revisited both 1954 events with a numerical hydrodynamic model and atmospheric observations. Their 2014 analysis identified Proudman resonance as the principal mechanism behind the destructive June 26 wave. Proudman resonance occurs when an atmospheric disturbance travels at approximately the same speed as a long water wave beneath it, allowing atmospheric energy to be transferred continuously into the wave as the two propagate together.
The June event could not be reproduced at its observed magnitude using atmospheric pressure changes alone. Bechle and Wu found that both pressure and wind perturbations were required in the model. The atmospheric disturbance generated a wave that crossed the lake, interacted with Lake Michigan’s bathymetry and shoreline, and produced the destructive response at Chicago.
The enclosed basin also retained wave energy after the principal surge. The model generated coastally trapped edge waves that persisted for hours, consistent with historical reports of continuing oscillations and dangerous currents that hindered rescue work well after the initial wave had passed.
Another meteotsunami reached Chicago on July 6, exactly 10 days after the fatal event. NOAA reports a wave height of about 1.25 m (4 feet). Forecasters had been instructed after June 26 to watch for storms moving with the speed and direction associated with large lake-level disturbances, and warnings were issued before the July event. No fatalities were reported.
The second event was not simply a weaker version of the first. Bechle and Wu found that the largest July 6 waves resulted from the superposition of coastally trapped edge waves and non-trapped waves. Proudman resonance dominated the destructive June 26 event, while a different combination of wave processes produced the maximum water levels 10 days later.
The warning outcome also requires historical context. The 1954 response was not equivalent to a modern dedicated meteotsunami forecasting system. Officials and forecasters had become alert to atmospheric conditions associated with the June disaster, allowing warnings to be issued when a similar weather setup crossed the lake in July.
Historical accounts do not agree on the exact death toll from June 26. NOAA’s National Ocean Service technical assessment, the Midwestern Regional Climate Center and peer-reviewed Great Lakes research report seven deaths, while other later NOAA and historical accounts report eight. The event can therefore be described conservatively as having killed at least seven people.
Research published in 2016 showed that meteotsunamis are not rare anomalies on the Great Lakes. Bechle and colleagues analyzed up to 20 years of water-level records from 32 monitoring locations and identified events exceeding 0.3 m (1 foot) that coincided with strong atmospheric pressure or wind disturbances.
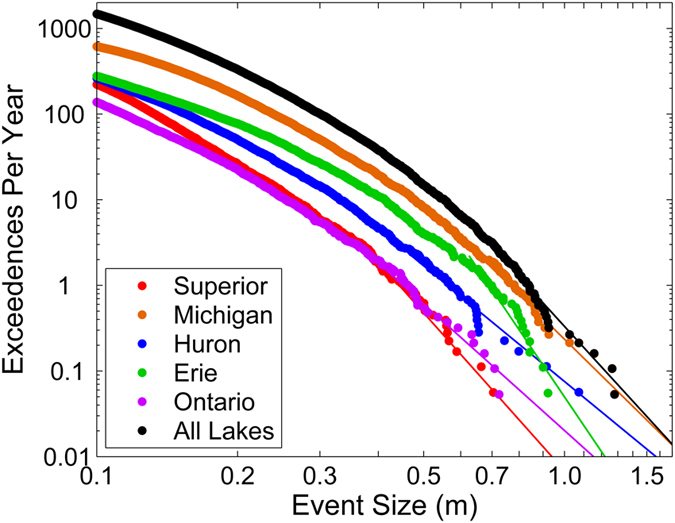
The study calculated an average of 106 meteotsunami events above its 0.3 m (1 foot) threshold per year across the Great Lakes. Lake Michigan had the highest lake-wide frequency in the dataset, with 51 events per year. At individual stations, Calumet Harbor in Illinois recorded the highest average frequency, at 29 events per year.
Frequency does not mean every event produces a 3 m wave at the shoreline. The 2016 analysis counted water-level oscillations above a defined threshold at monitoring stations, while local bathymetry, reflection, harbor geometry, resonance and shoreline configuration can substantially change wave height and currents as a meteotsunami approaches land.
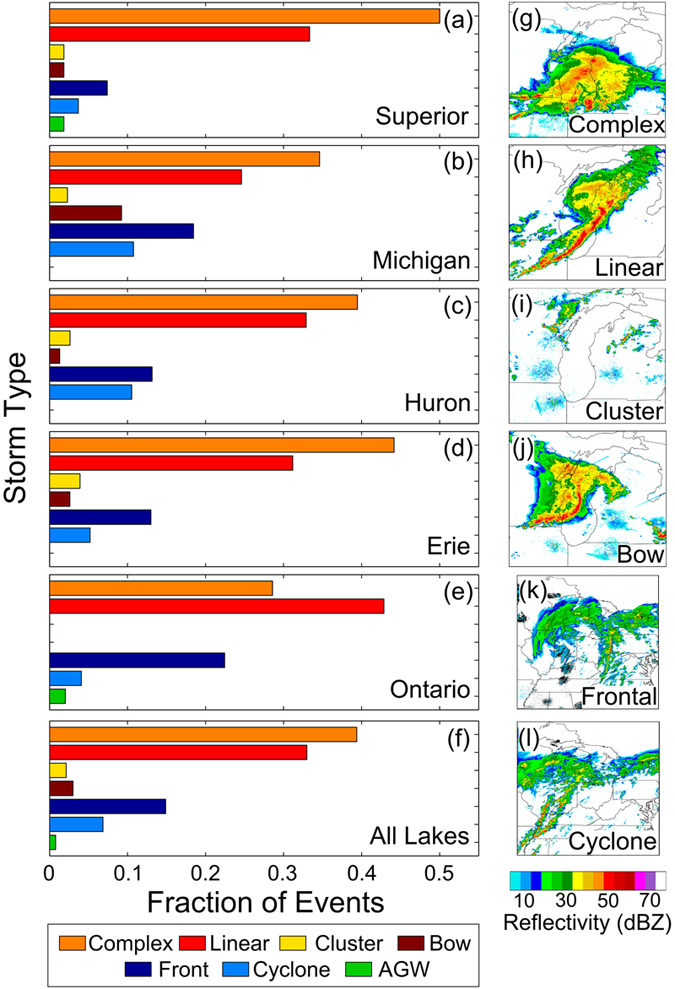
Convective storms dominated the meteorological environment associated with the identified waves. Across the five lakes, 78% of meteotsunamis exceeding the study’s one-year return-level threshold were associated with convective storm structures. Convective complexes accounted for 39% and linear convection for 33% of those events.
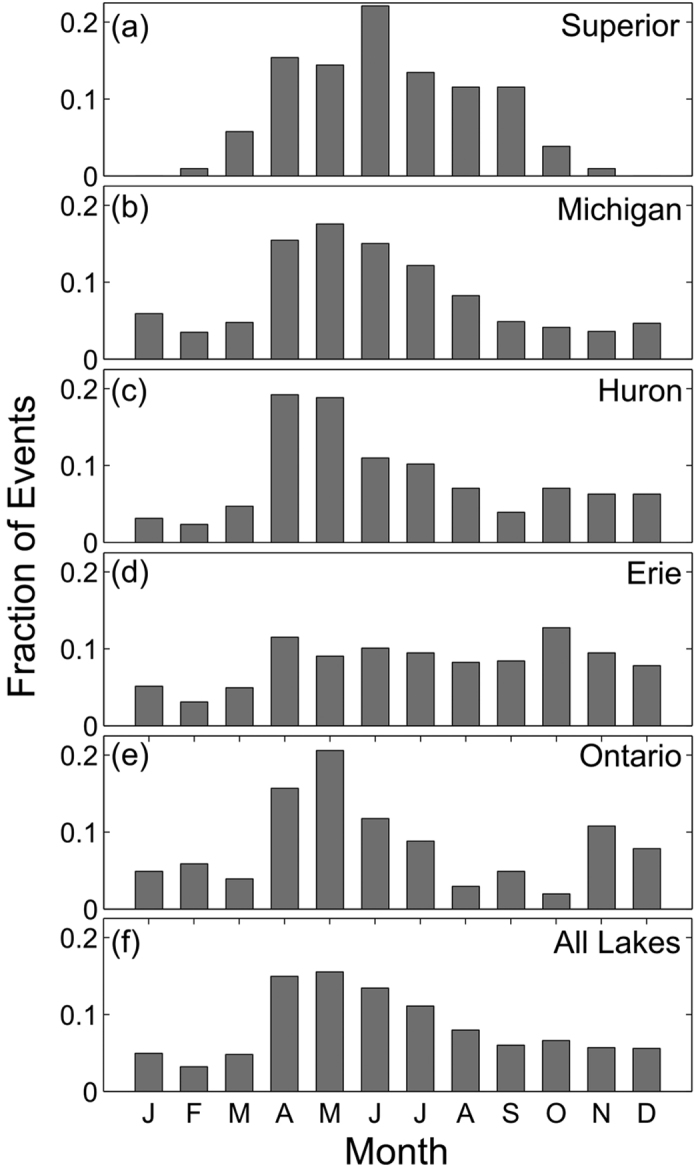
The regional analysis also established a strong seasonal pattern. Great Lakes meteotsunami occurrence increased sharply during spring, reached its regional maximum around May and declined through the warmer months. Lake Michigan and Lake Huron showed strong late-spring and early-summer concentrations, placing the June 1954 events within the part of the year when the later observational record found the phenomenon to be comparatively common.
The timing reflects more than the number of thunderstorms. Meteotsunami generation depends on whether a moving atmospheric disturbance can transfer energy efficiently into waves whose propagation speed is controlled by water depth and basin geometry. Fast-moving spring and early-summer storm systems can therefore create more favorable resonance conditions even when peak convective activity occurs later in summer.
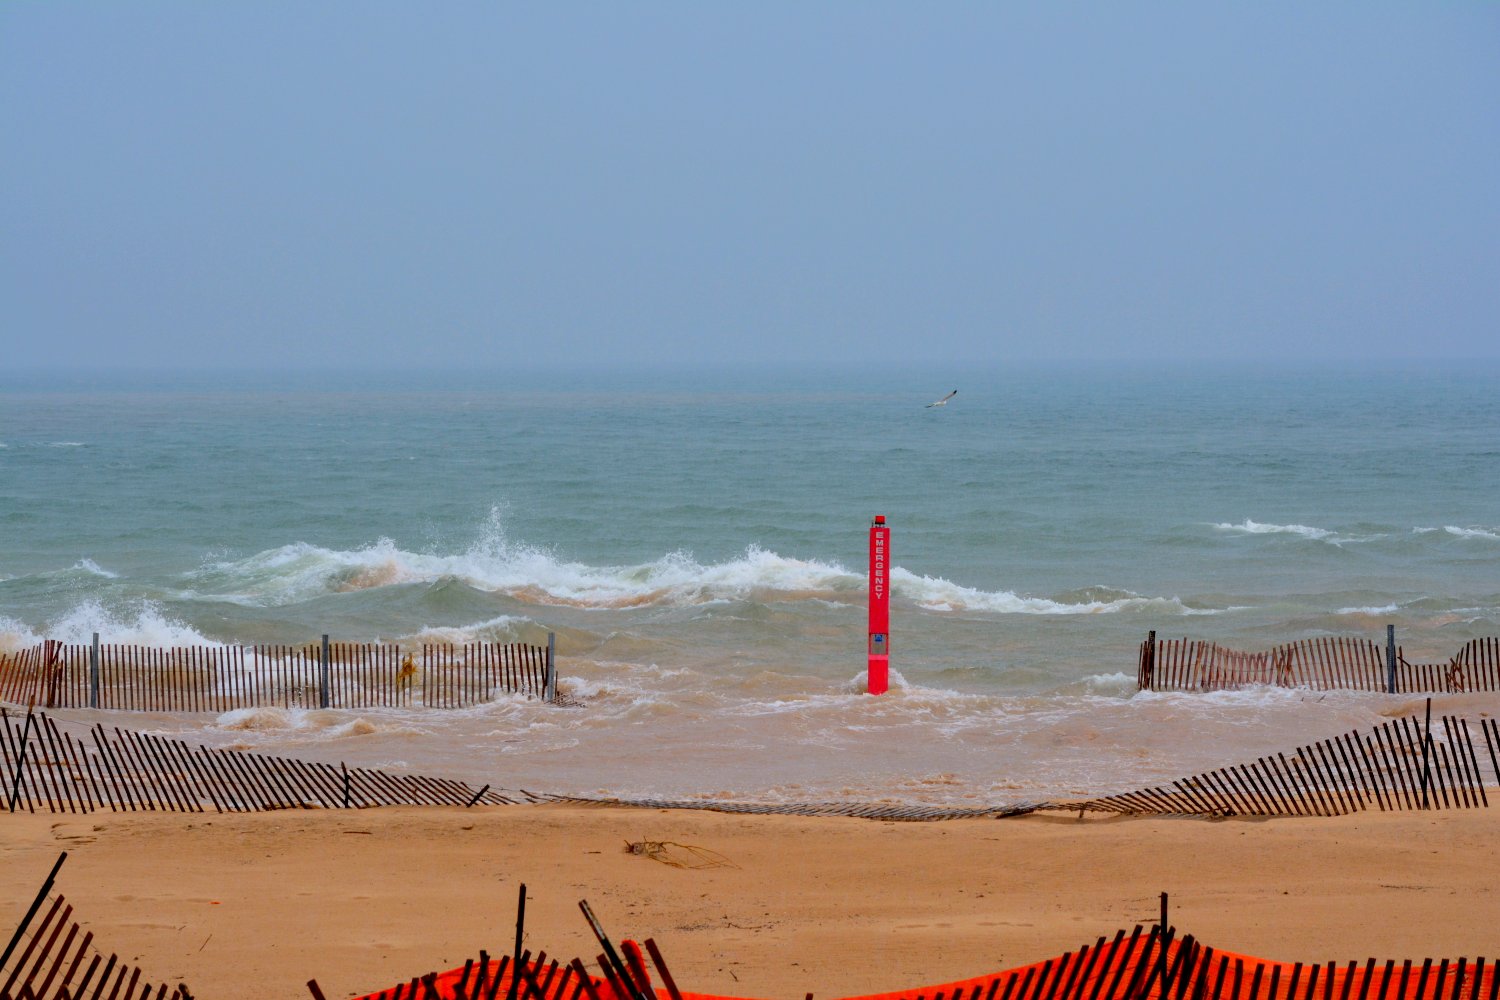
Modern observations have provided evidence that was unavailable in 1954. A Lake Michigan meteotsunami near Ludington, Michigan, on April 13, 2018 damaged homes and boat docks and was subsequently reconstructed using photographs, water-level observations, atmospheric data and numerical modeling. NOAA Great Lakes Environmental Research Laboratory researchers associated that event with an atmospheric gravity wave producing rapid pressure changes over the lake.
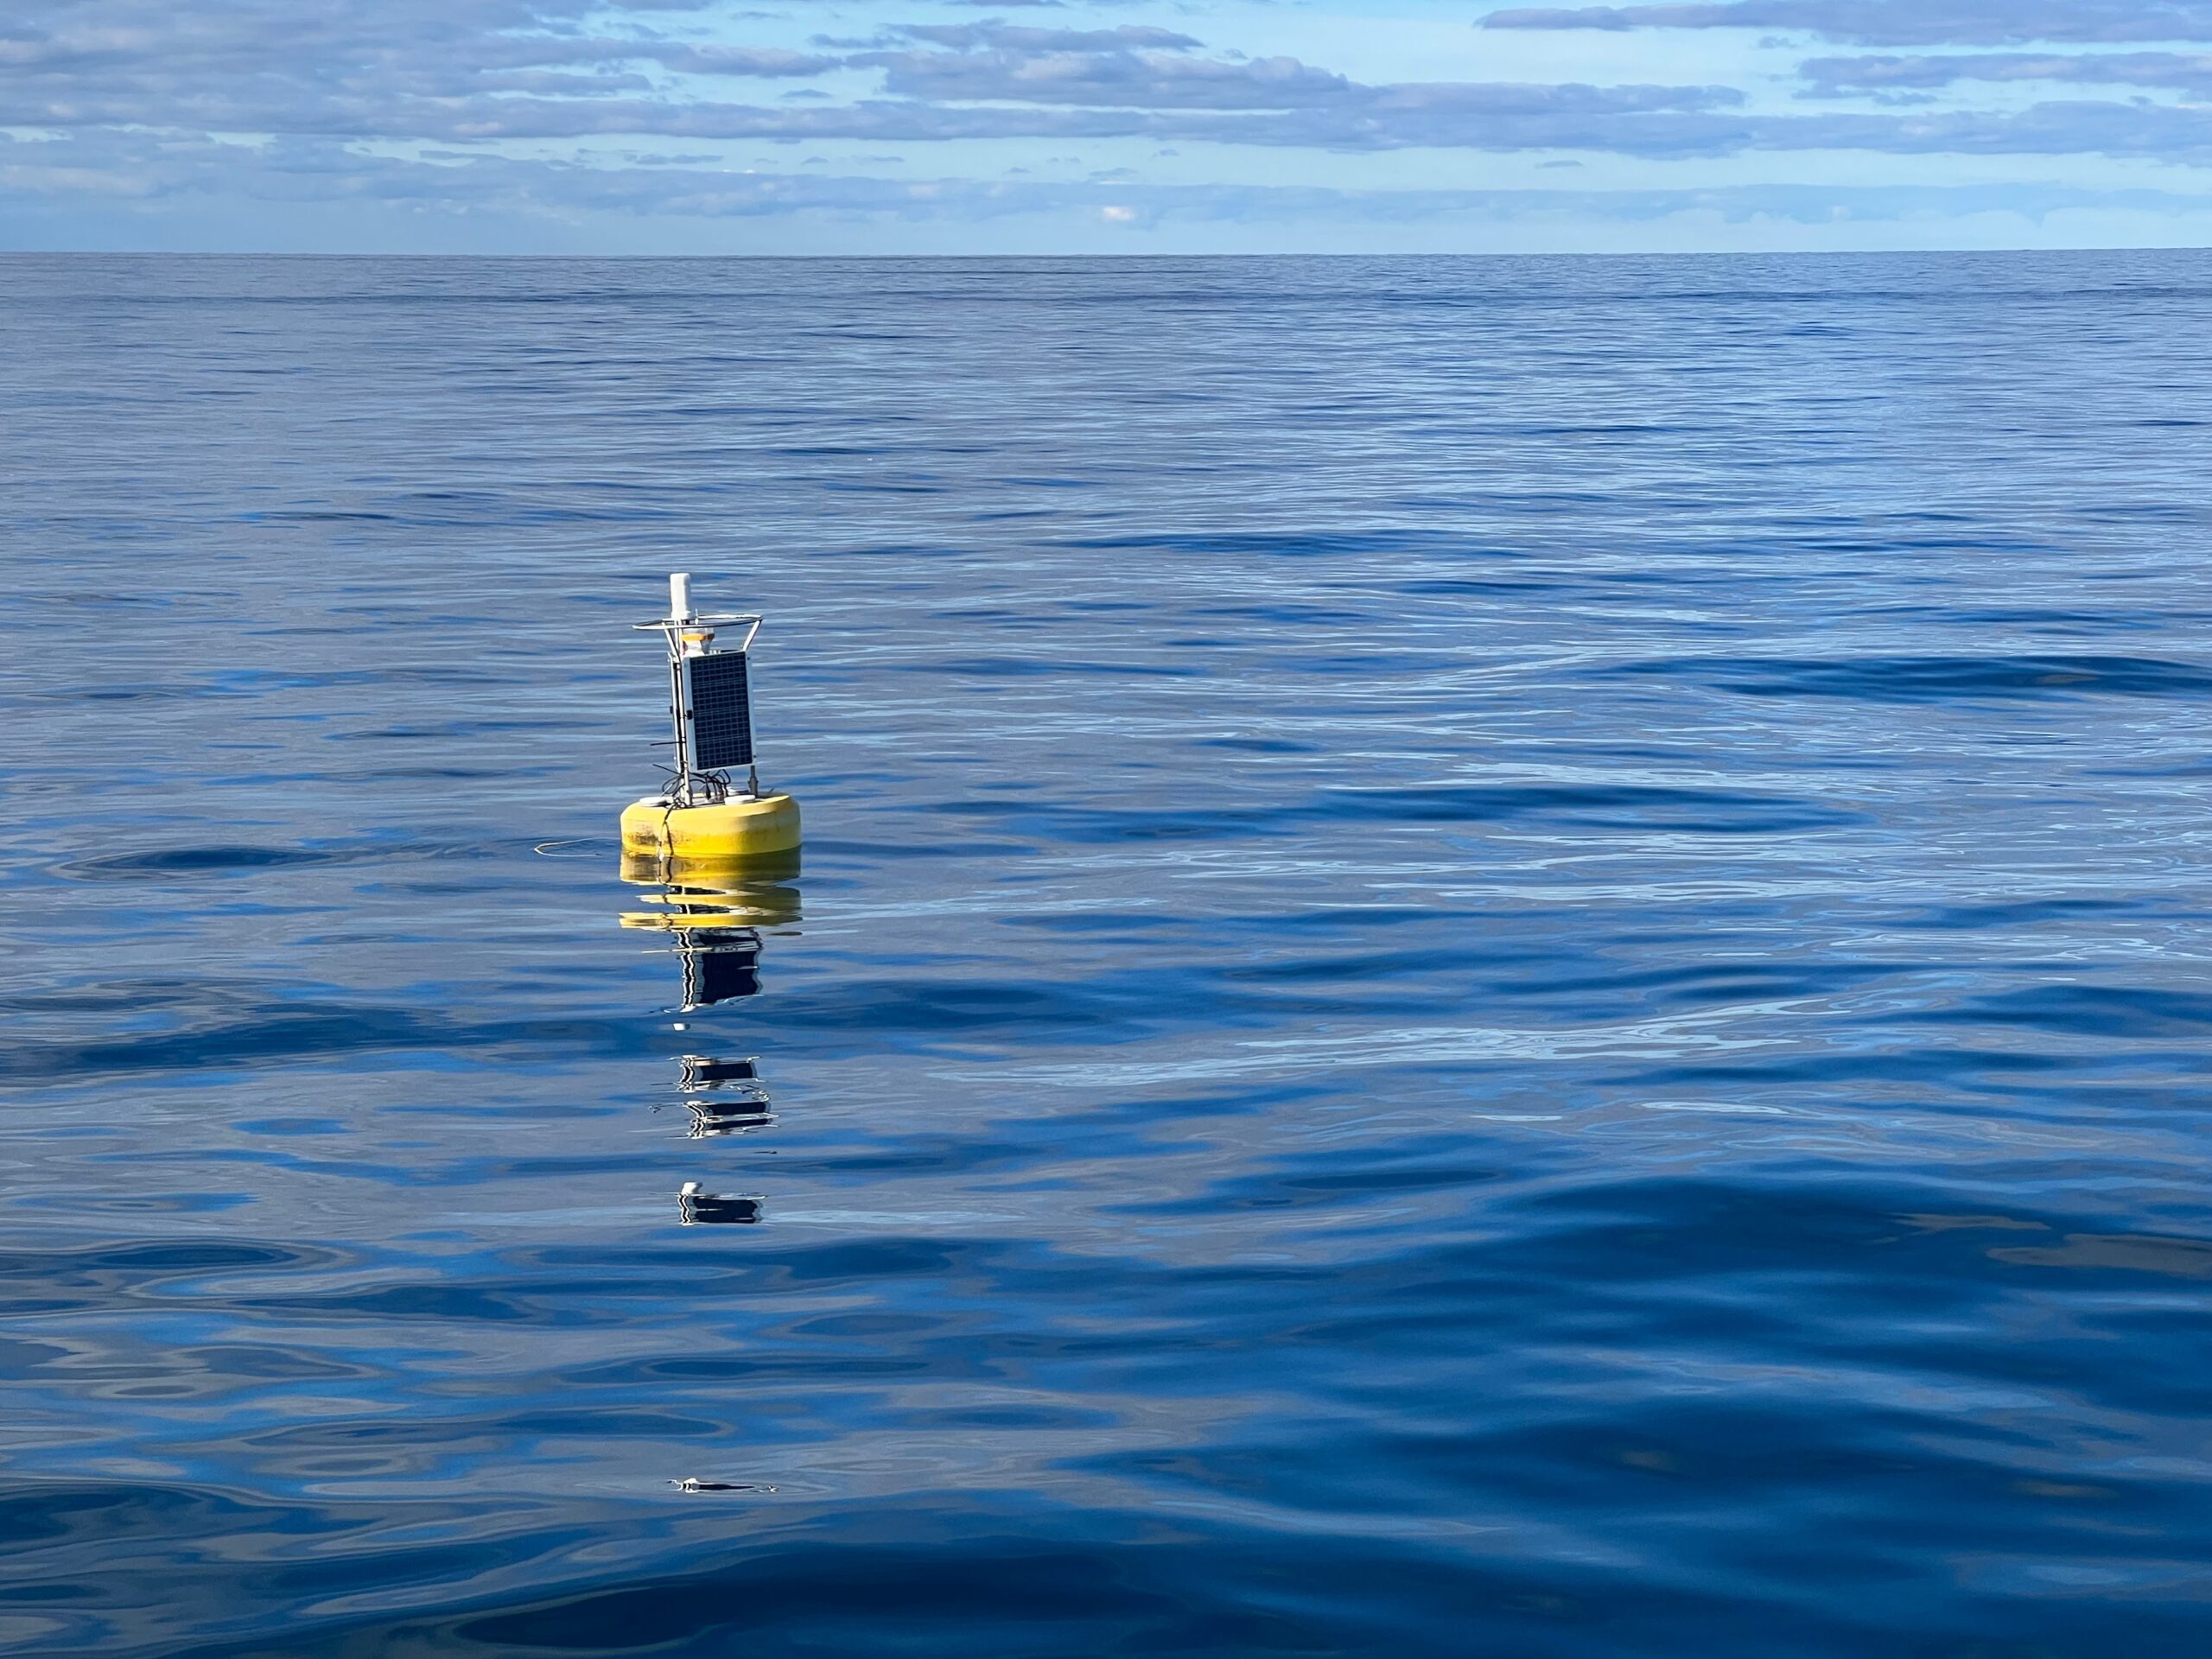
NOAA GLERL later deployed an experimental deep-water instrument in Lake Michigan to measure small, rapid changes in water level that can accompany meteotsunamis. The buoy was first deployed in 2021 and is being used to investigate whether real-time lake observations and atmospheric modeling can eventually improve detection and warning capability.

The 1954 events remain important because they show both the destructive potential of atmospheric waves on an enclosed freshwater basin and the difficulty of recognizing the hazard from conditions at the shoreline. The June wave reached Chicago after the responsible storms had already passed, while later modeling showed that reflection, resonance and persistent edge waves separated the most dangerous water motion from the weather system that generated it.
Modern monitoring has improved the observations available to researchers, but NOAA still treats reliable meteotsunami detection and advance warning as an active research problem. The physical requirements are restrictive: the atmospheric disturbance, its speed and direction, lake depth, shoreline geometry and resonant response must align closely enough for a dangerous wave to develop. The same sensitivity that produced the destructive June 1954 event also makes individual meteotsunamis difficult to forecast before the atmospheric disturbance begins transferring energy into the lake.
References:
1 Bechle, A. J., & Wu, C. H. (2014). The Lake Michigan meteotsunamis of 1954 revisited. Natural Hazards, 74(1), 155–177. DOI: 10.1007/s11069-014-1193-5
2 Bechle, A. J., Wu, C. H., Kristovich, D. A. R., Anderson, E. J., Schwab, D. J., & Rabinovich, A. B. (2016). Meteotsunamis in the Laurentian Great Lakes. Scientific Reports, 6, 37832. DOI: 10.1038/srep37832
3 Addressing the Meteotsunami Risk in the United States – National Oceanic and Atmospheric Administration – 2020

I’m a science journalist and researcher at The Watchers, contributing to the Epicenter edition, where I cover peer-reviewed scientific research and emerging discoveries across Earth and space sciences. With a background in astronomy and a passion for environmental science, I’ve worked in shark and coral conservation in Fiji, conducting reef and shark-behavior research, contributing to mangrove restoration, and earning PADI Open Water and Coral Reef Certifications. I bring a blend of scientific rigor and storytelling to illuminate the discoveries shaping our planet and beyond.
Published in the last 24 hours
- Just 12 inches of rushing water can carry away most cars, and more than half of US flood drownings happen to people who drive into flood water Epicenter
- People who hid under an Oklahoma highway overpass from a 1999 tornado lost fingers, ears and noses, and three people died near or under overpasses that day Epicenter
- In January 1862, California’s new governor took a rowboat to his own inauguration, after 45 days of storms had turned the Central Valley into a lake up to 300 miles long Epicenter
- People who stayed put through the 2017 hurricanes were more often the ones with flood insurance, a survey of 2,557 Gulf Coast residents found, and the authors suggest the policy may have made the storm feel less dangerous Epicenter
