
Just 12 inches of rushing water can carry away most cars, and more than half of US flood drownings happen to people who drive into flood water
Fast-moving floodwater just 30 cm (12 inches) deep can carry away a small car, according to the U.S. National Weather Service. Full-scale tests in Australia show how rising water can reduce tyre grip before a vehicle floats, allowing the current to push it sideways.
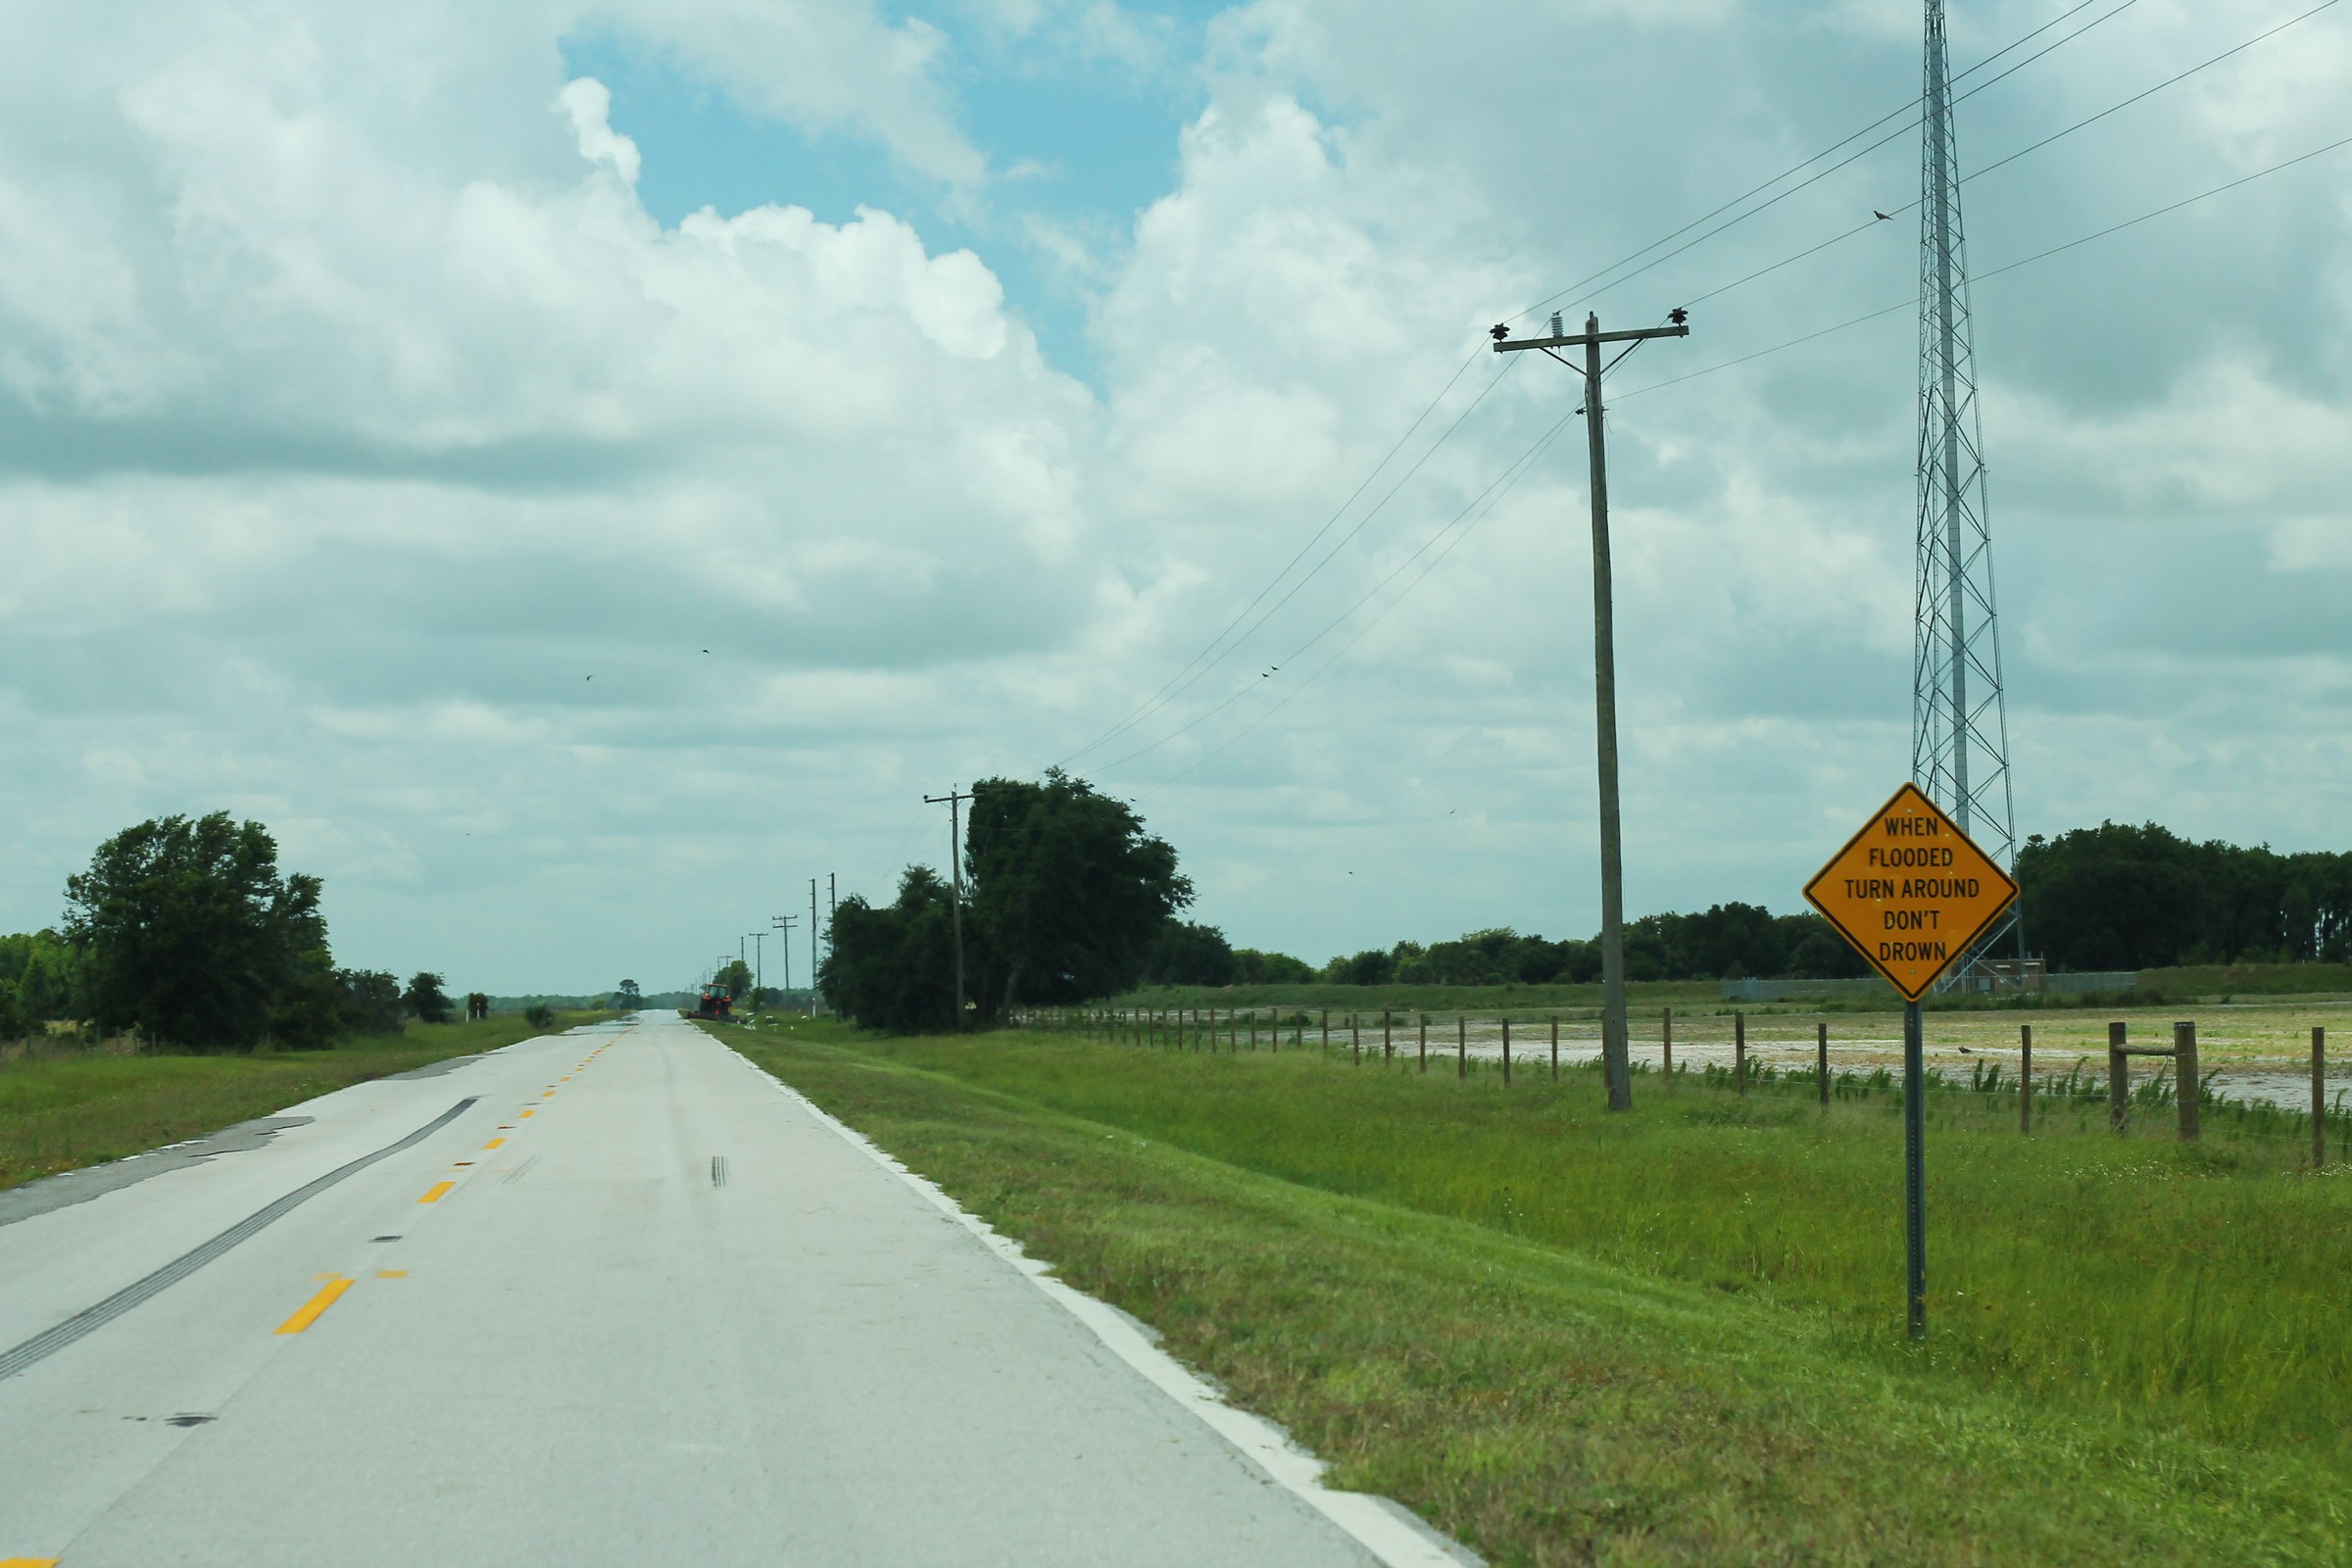
CR419 South - When Flooded Turn Around Sign (43910400674). Credit: formulanone from Huntsville, United States (CC BY-SA 2.0), via Wikimedia Commons.
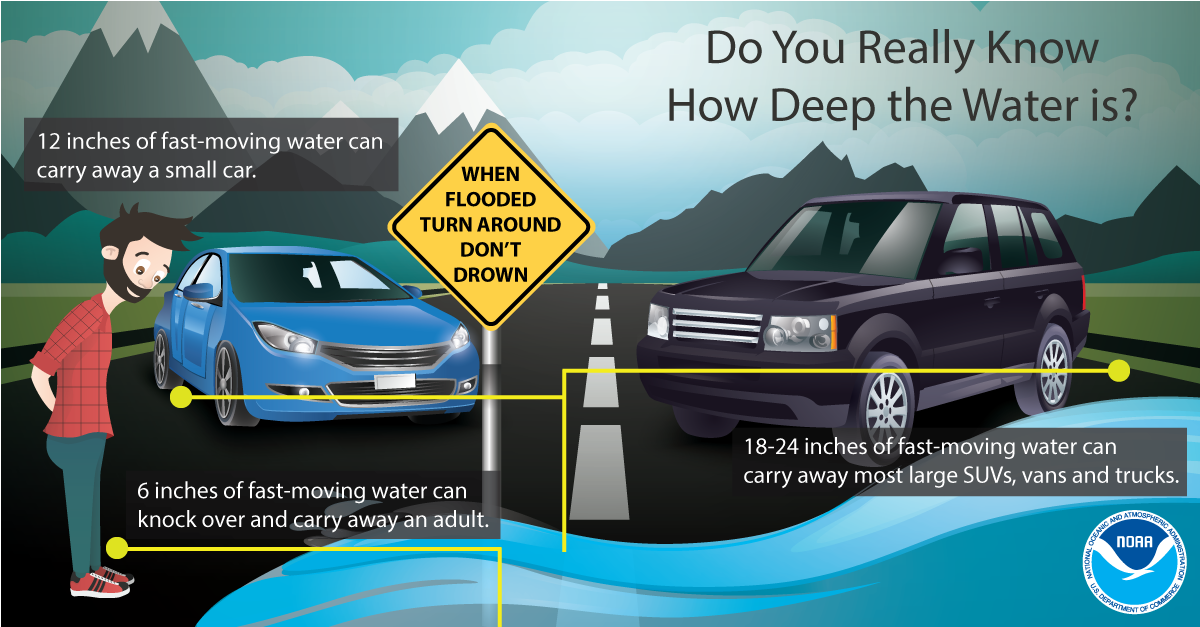
The National Weather Service (NWS) separates floodwater danger by vehicle size rather than presenting one depth as a universal threshold. Its flood-safety guidance states that approximately 15 cm (6 inches) of fast-moving water can knock over and carry away an adult, 30 cm (12 inches) can carry away a small car, and 46–61 cm (18–24 inches) can carry away most large SUVs, vans and trucks.
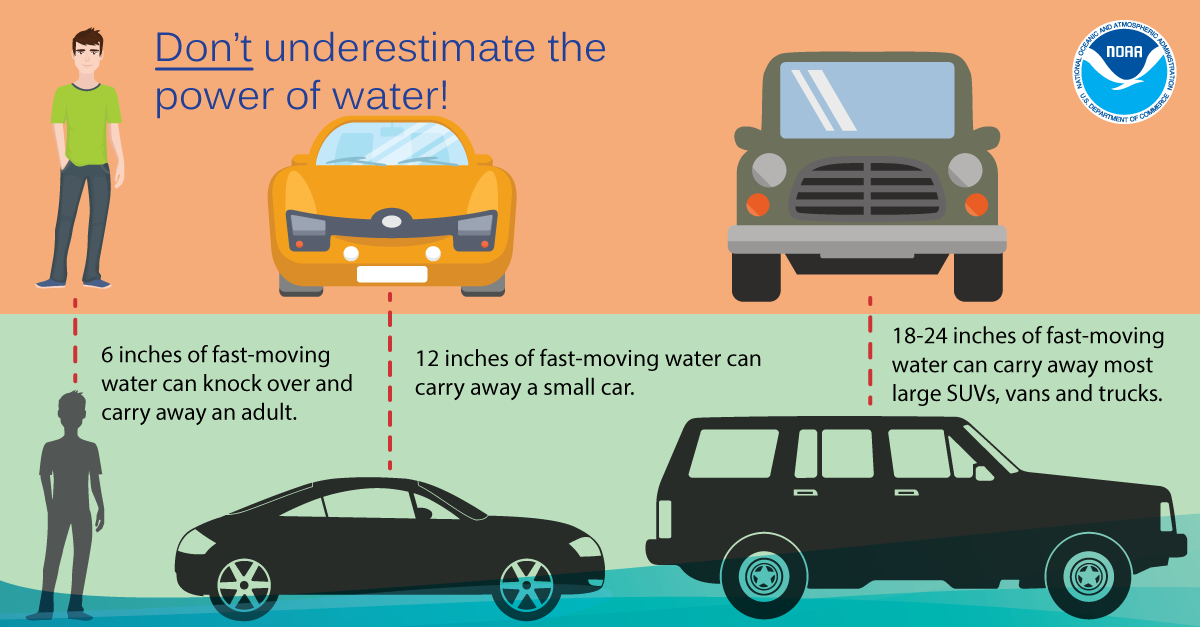
The figures are public-safety thresholds, not universal flotation depths. Whether a vehicle moves depends on the water depth and velocity, the vehicle’s mass and dimensions, ground clearance, weight distribution, the volume of air trapped inside the body, tyre contact with the road and the direction of the flow.
Full-scale experiments at the University of New South Wales Water Research Laboratory (UNSW WRL) examined those forces using a 2006 Toyota Yaris and a 1998 Nissan Patrol. The Yaris had a mass of 1 045 kg (2 304 lb), measured 4.3 m (14.1 feet) long and had a measured floorpan height of 15.5 cm (6.1 inches). The Patrol weighed 2 478 kg (5 463 lb), measured 4.97 m (16.3 feet) long and had a floorpan height of 50 cm (19.7 inches).
The researchers measured the force needed to move the full-size vehicles sideways at increasing static water depths and conducted separate hydrodynamic tests with a 1:18-scale vehicle model. The combination allowed them to compare the decreasing traction of a partially buoyant vehicle with the horizontal force produced by moving water.
Vehicle stability begins to deteriorate before a car is completely afloat. Once water reaches the body, buoyancy supports part of the vehicle’s weight and reduces the normal force pressing the tyres against the road. Less tyre loading means less friction is available to resist the horizontal force of the current.
Weight distribution adds another weakness. In most front-engined vehicles, more mass is concentrated over the front axle. The UNSW tests confirmed that the rear wheels, which are less heavily loaded by the engine, lost traction considerably earlier than the front wheels. Once the rear wheels break free, flowing water can rotate the vehicle around the front axle before carrying it away from the roadway.
For the Toyota Yaris, the force needed to move the vehicle sideways fell rapidly once water exceeded roughly 20 cm (7.9 inches), just above its floorpan level. At about 60 cm (23.6 inches) of static water, the rear wheels were clear of the floor and effectively no horizontal force was needed to move the rear of the vehicle sideways.
The larger Nissan Patrol followed the same physical pattern at greater depths. The force required to move it dropped sharply once water reached approximately 45 cm (17.7 inches), just above its floorpan. At approximately 95 cm (37.4 inches), its rear wheels were completely off the floor and effectively zero horizontal force was required to move the rear of the vehicle.
UNSW summarized the practical result in 2016 by reporting that a Toyota Yaris weighing about 1.05 tonnes (2 315 lb) could be moved in water only 15 cm (5.9 inches) deep flowing at approximately 1 m/s (3.6 km/h; 2.2 mph). The same institutional summary reported that the Yaris became fully buoyant at about 60 cm (23.6 inches), while the 2.5-tonne (5 512 lb) Patrol became unstable at about 45 cm (17.7 inches) under a similar flow speed.
The technical report nevertheless adopted more conservative thresholds for floodplain and emergency management rather than treating the individual vehicle tests as safe crossing limits. For a small passenger vehicle, the adopted limiting depth was 30 cm (11.8 inches) in still water and 15 cm (5.9 inches) at a high flow velocity of 3 m/s (10.8 km/h; 6.7 mph). For a large four-wheel-drive vehicle, the corresponding thresholds were 50 cm (19.7 inches) and 30 cm (11.8 inches).
The report found that the vehicles tested were actually more stable than the conservative interim flood-hazard curves used for emergency planning. The authors retained those lower thresholds because real floods involve irregular road surfaces, debris, changing depths and velocities, uneven approaches to causeways, damaged infrastructure and other conditions that controlled laboratory testing cannot reproduce.
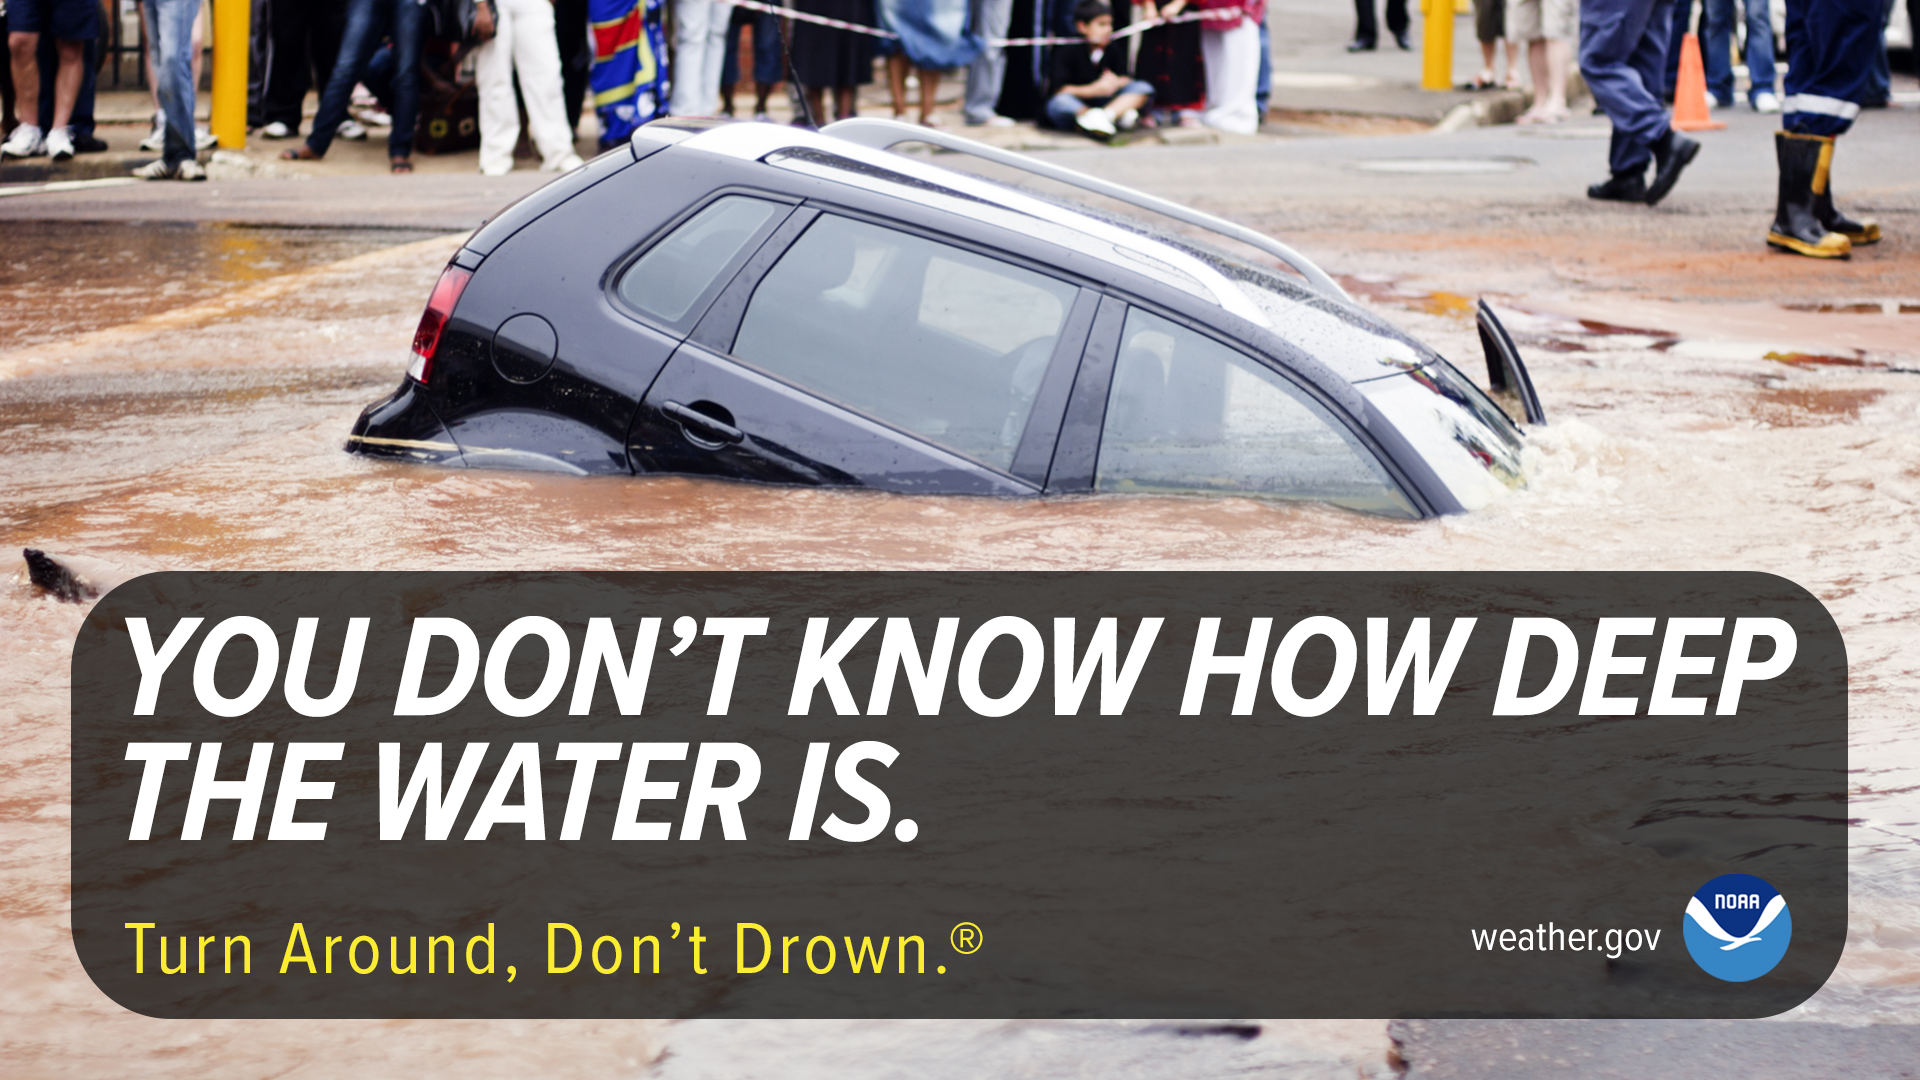
Depth by itself therefore cannot determine whether a crossing is safe. Water 20 cm (7.9 inches) deep moving slowly does not exert the same horizontal force as water of the same depth moving rapidly, while a light, low vehicle behaves differently from a tall, heavy vehicle. Floodwater can also rise or accelerate while a vehicle is crossing.
The physical mechanism can be reduced to two competing effects. Vehicle weight and tyre friction resist movement, while buoyancy reduces the effective weight carried by the tyres and flowing water produces drag against the body. As water rises, the resisting force falls at the same time that the water can apply a larger horizontal force.
The U.S. fatality record shows why the mechanics matter. Han and Sharif examined 6 478 flood deaths in the 48 contiguous states and the District of Columbia from 1959–2019 using NOAA Storm Data. The 61-year record covered deaths associated with several flood classifications, including flash flooding, flooding, heavy rain and tropical systems.
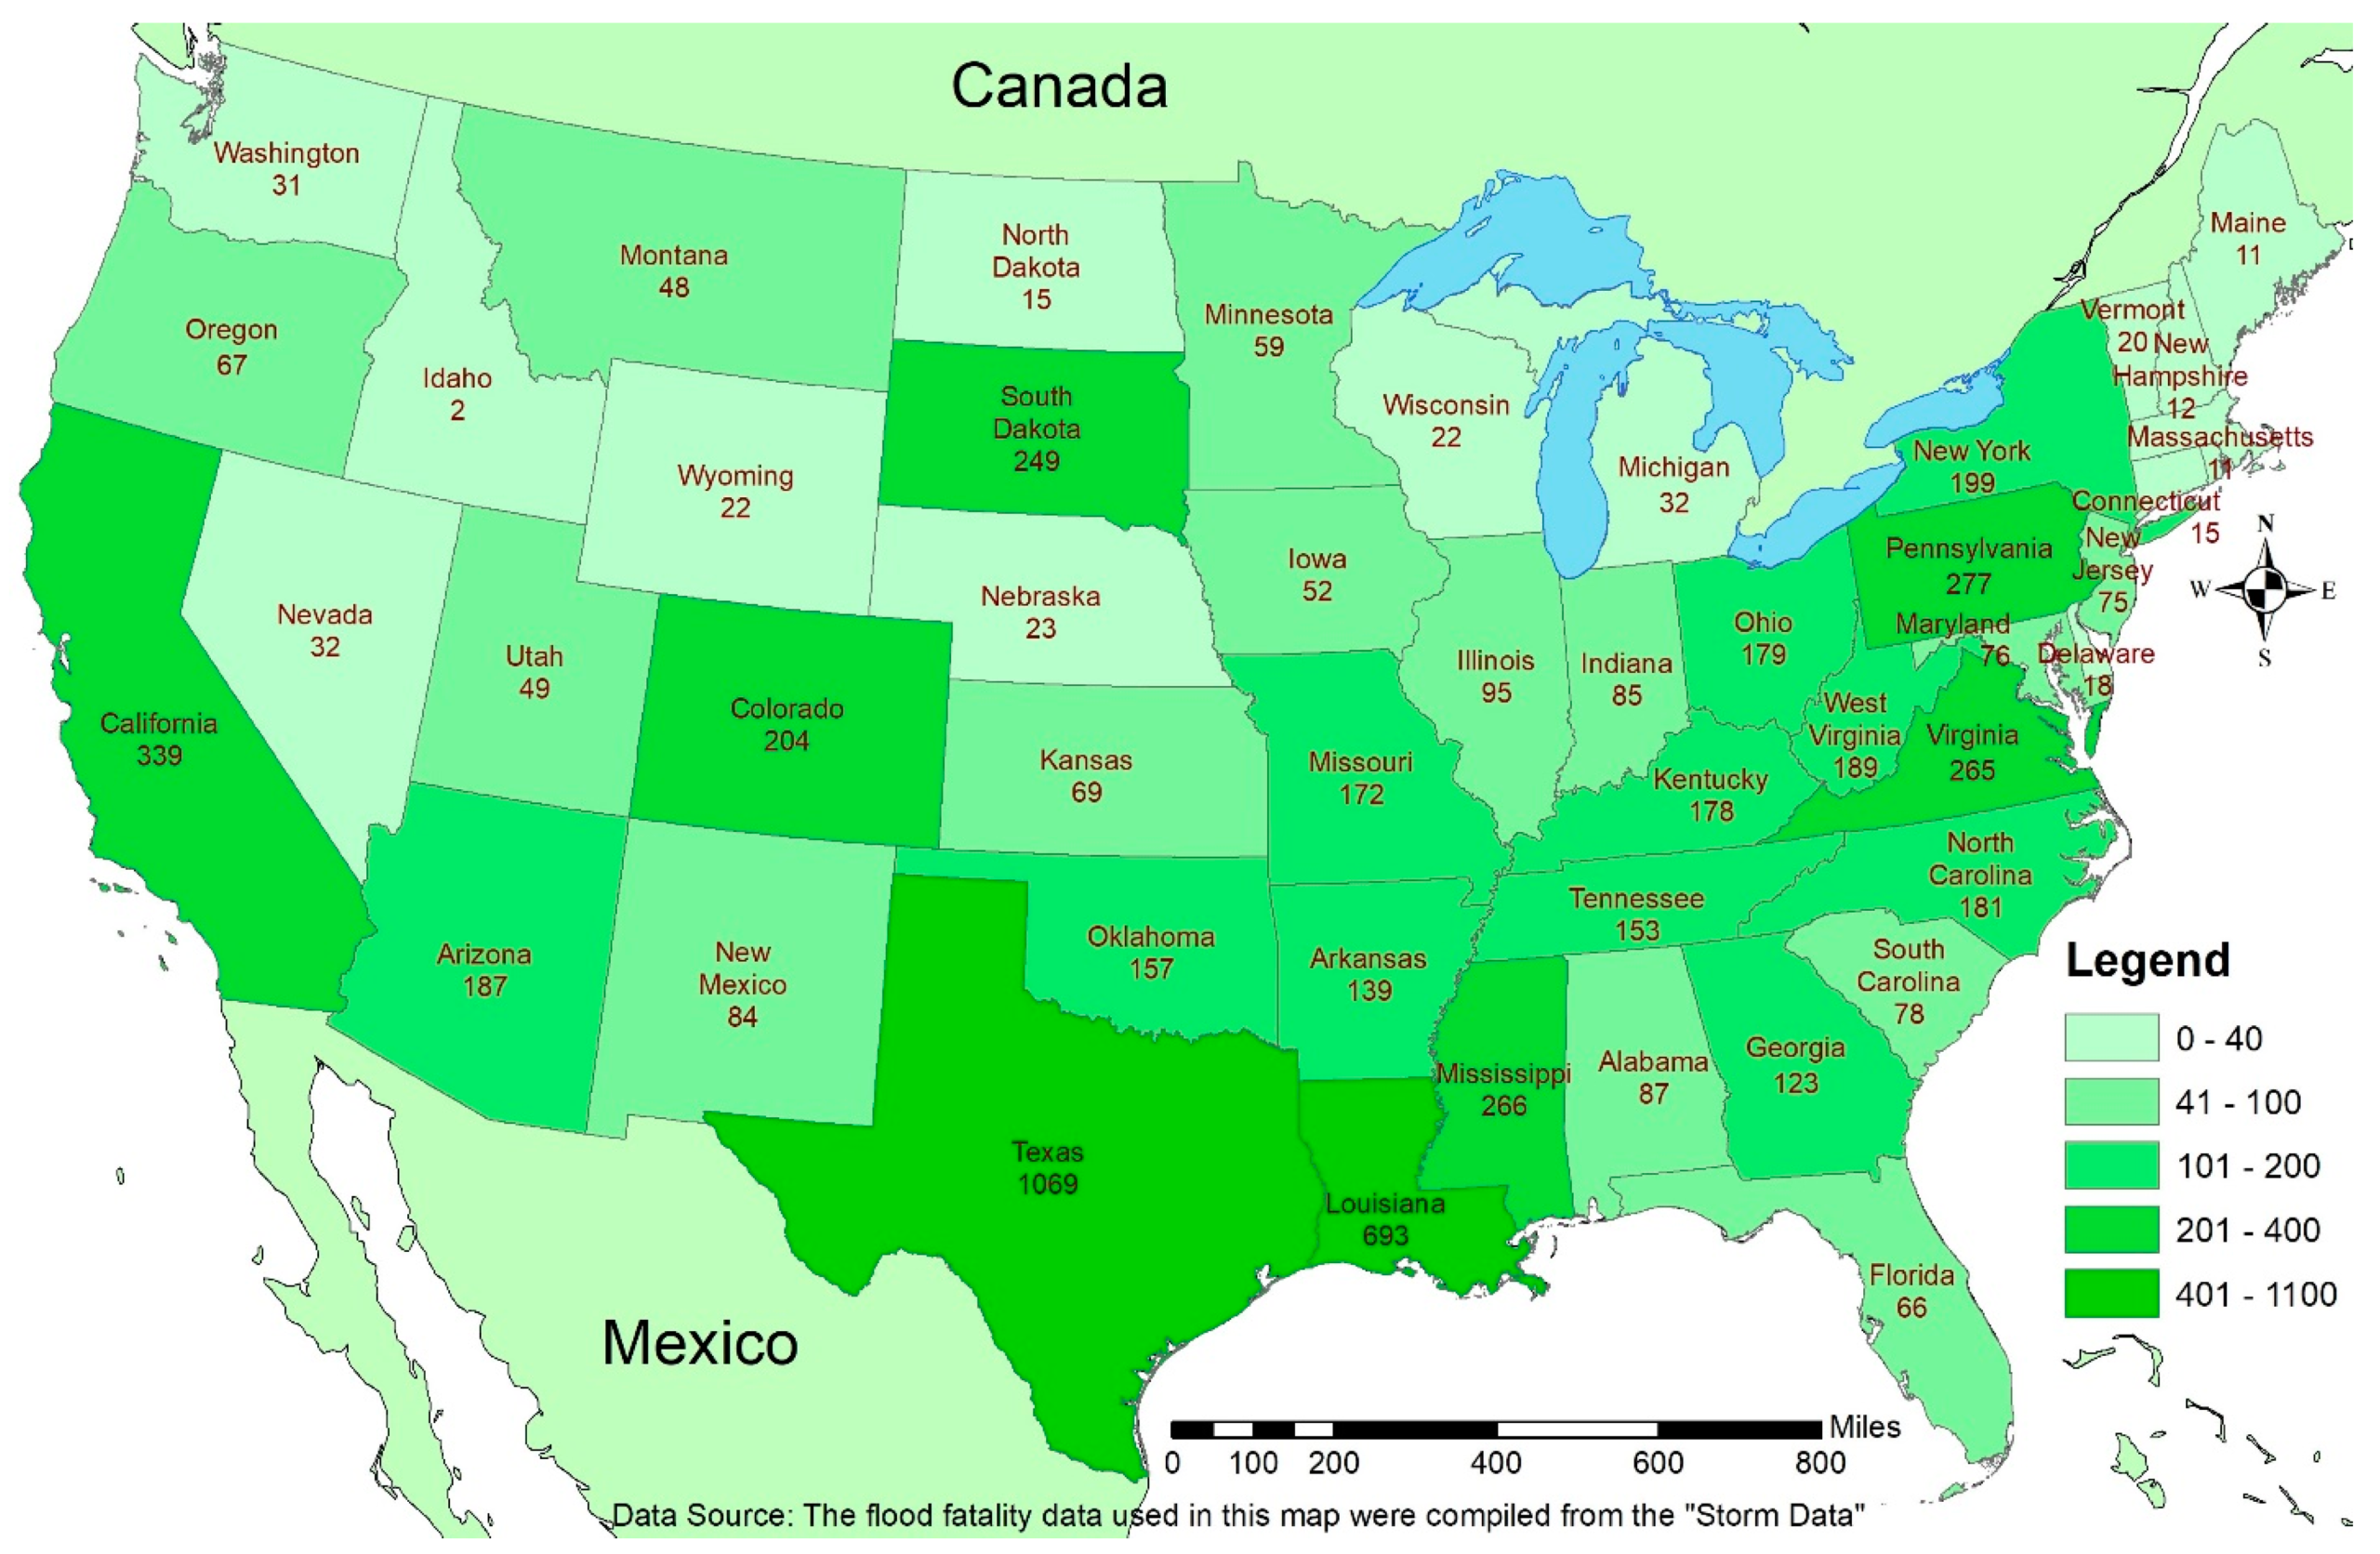
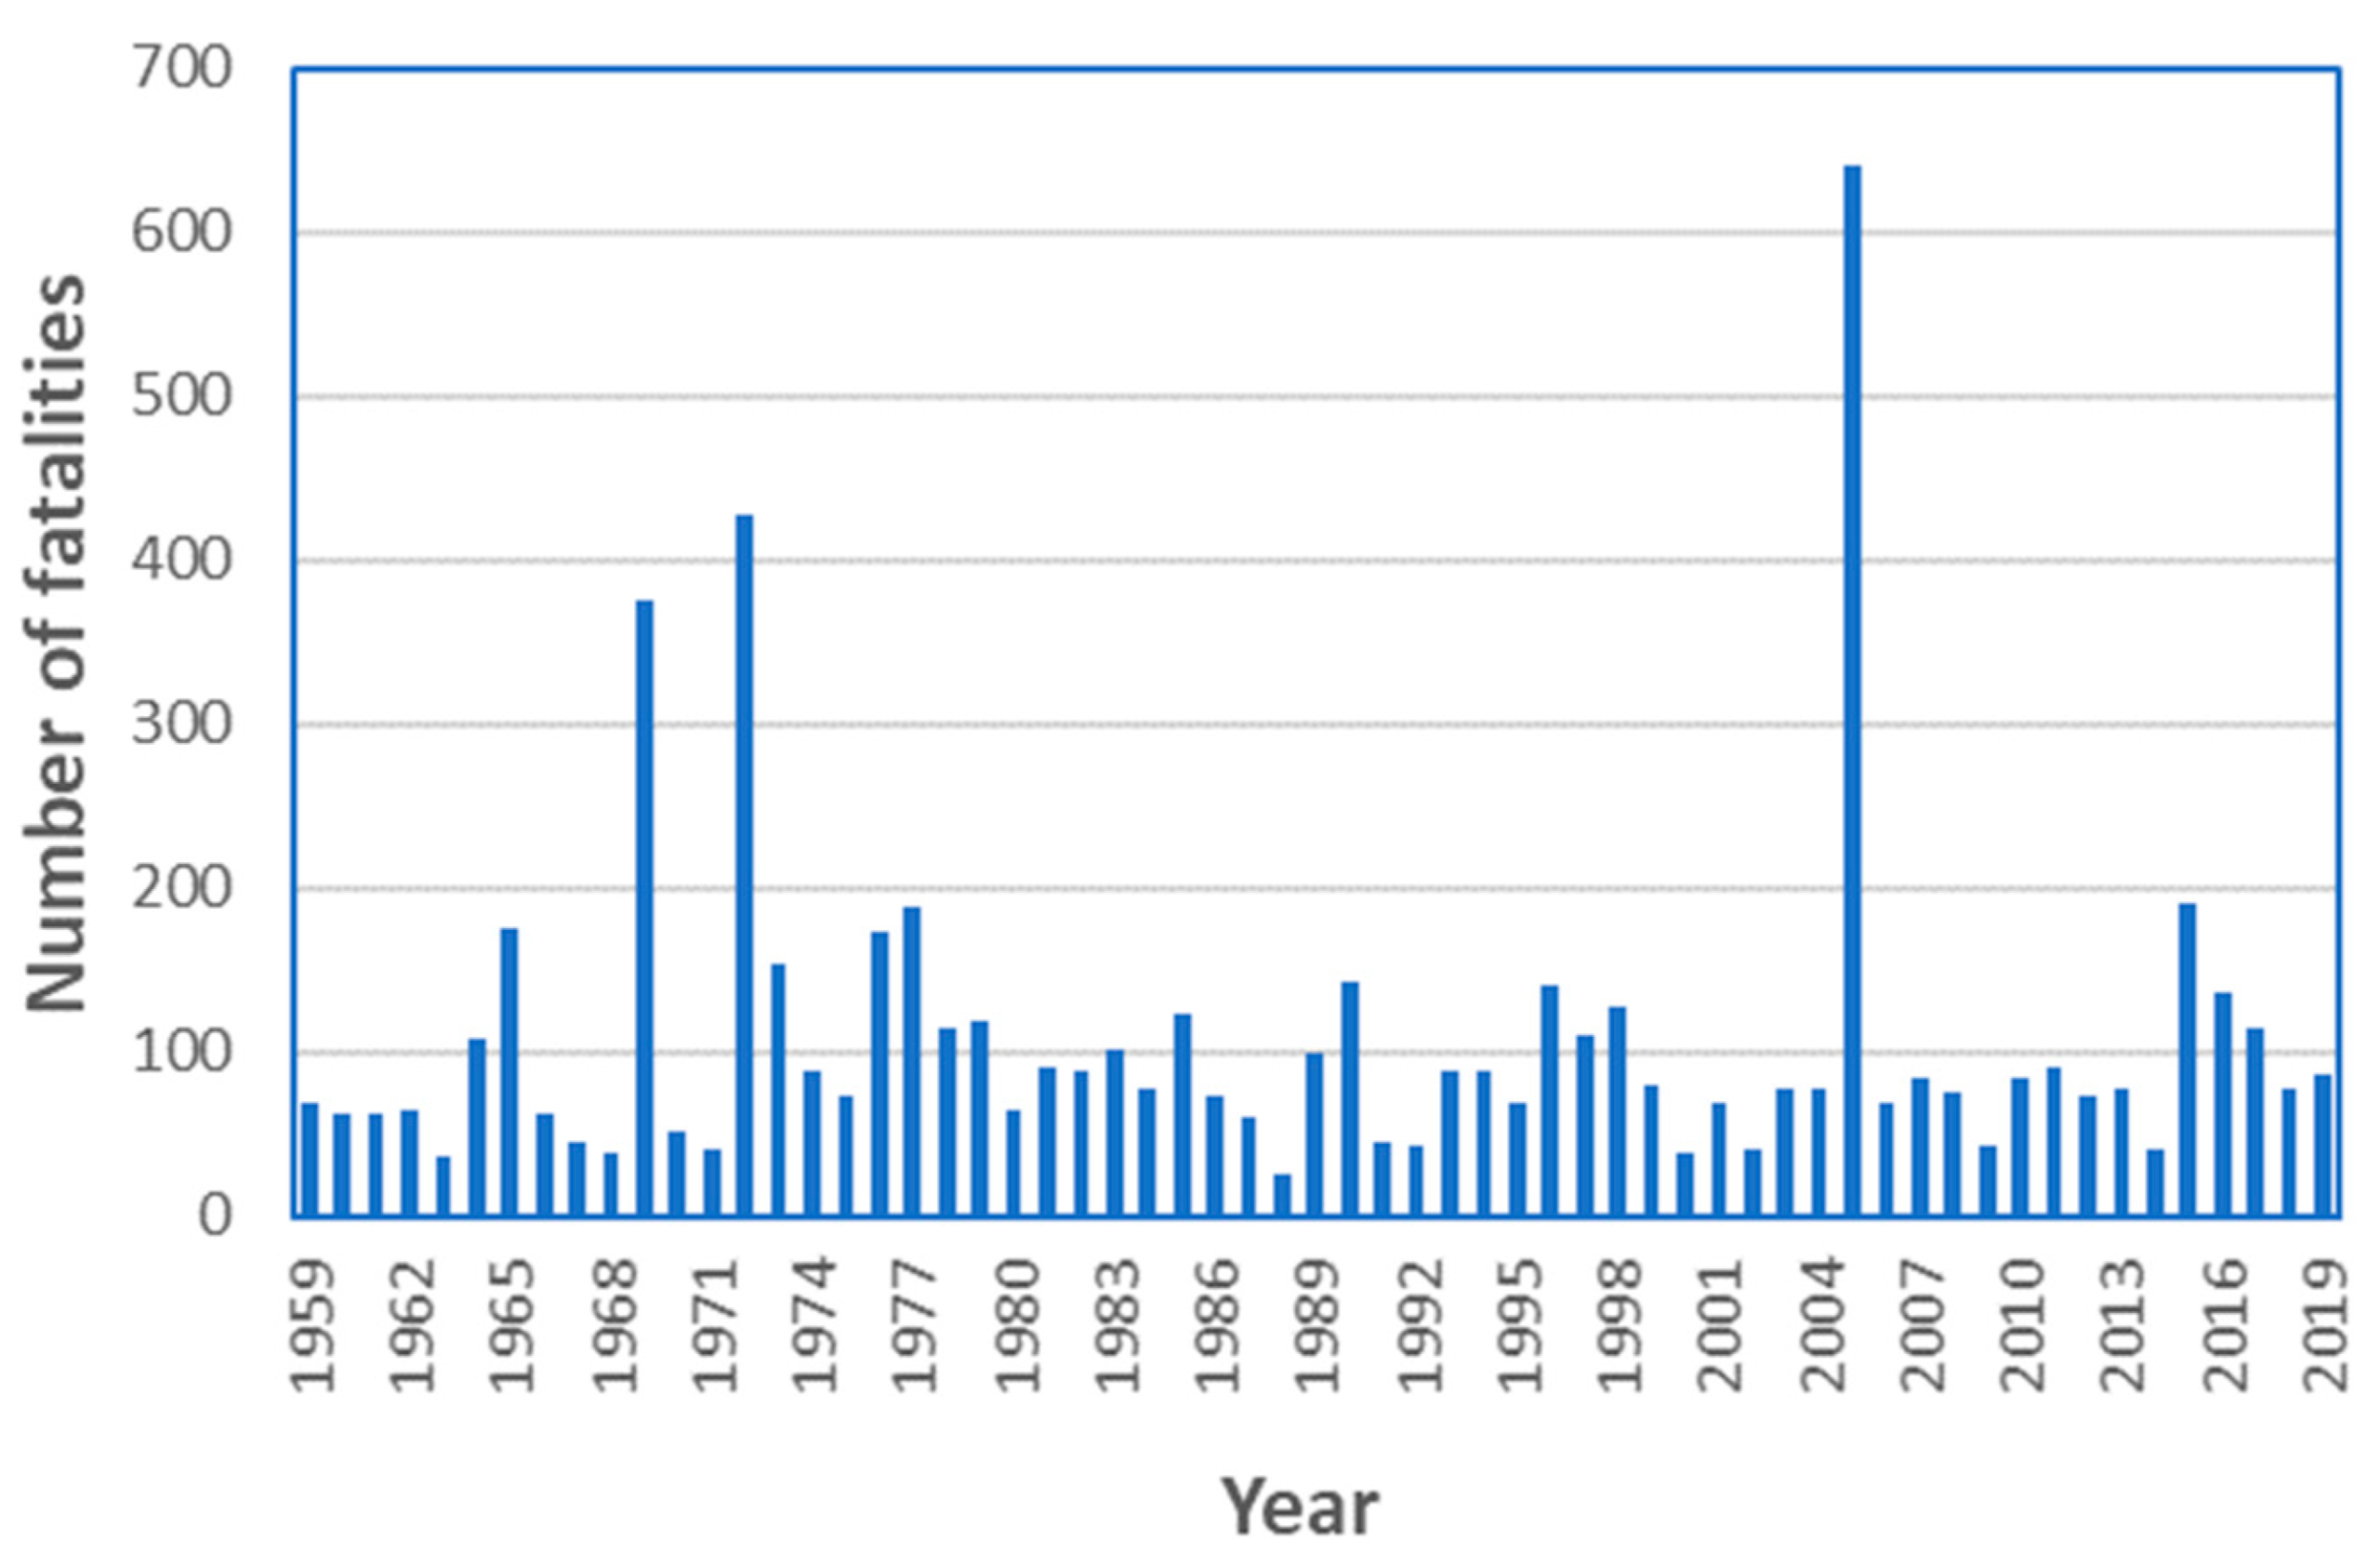
The study recorded an average of about 106 flood fatalities per year, but the annual total varied widely. The lowest annual count was 25 in 1988, while 2005 reached 640 fatalities, with Hurricane Katrina producing a major spike in the long-term series.
The circumstances surrounding a death were not available for every fatality. Storm Data contained circumstance information for only 59% of the 6 478 deaths, making that smaller group the denominator for the study’s vehicle and behavior statistics.
Among fatalities with known circumstances, 2 201 deaths, or 57.80%, involved vehicles. Another 1 079 deaths, or 28.34%, were classified as “in water,” which the researchers defined as people who purposely entered floodwater on foot.
Together, those two categories accounted for 86.13% of deaths with known circumstances. The qualification is essential: 86.13% does not represent all 6 478 fatalities because circumstance information was missing for approximately 41% of the complete dataset.
The vehicle proportion also should not be read as a fixed percentage for every year or every flood. Fatality totals changed sharply between events, and earlier U.S. studies produced vehicle-related shares ranging from about 40% to 63% depending on the period, location and classification method.
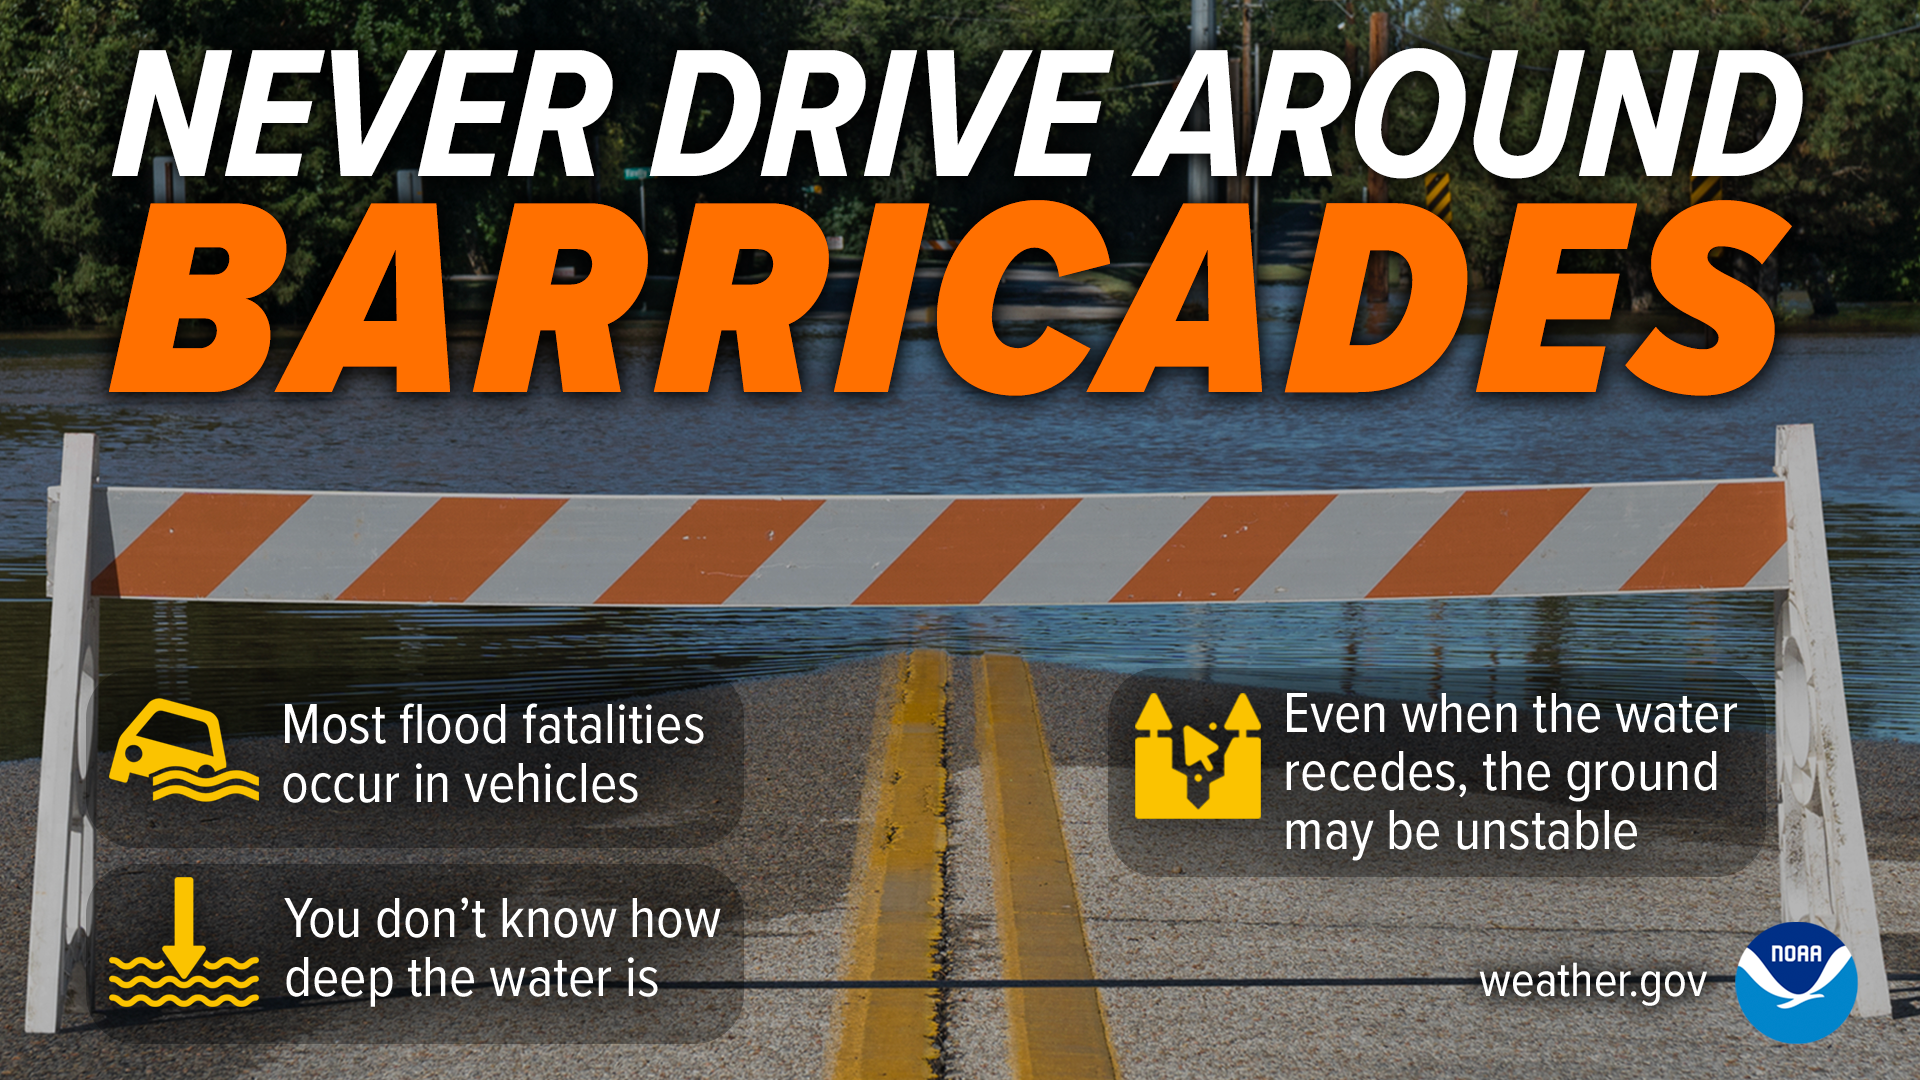
NWS converts those complicated physical and behavioral risks into a much simpler instruction. Drivers and pedestrians are told not to enter floodwater because the depth cannot be reliably determined by looking at it and the roadway underneath may have been damaged or washed away.

The laboratory measurements explain why estimating a personal “safe depth” from inside a vehicle is unreliable. A car does not have to be completely afloat before control deteriorates. Partial buoyancy can unload one axle, reduce tyre friction and allow the current to rotate the vehicle, after which it can be pushed into deeper and faster water.
The UNSW report therefore treats its stability curves as tools for floodplain and emergency planning rather than instructions for motorists attempting a crossing. Its controlled tests quantify how depth, velocity, buoyancy and vehicle geometry interact; NWS guidance removes the need for a driver to estimate those variables at all by advising them to turn around.
References:
1 Smith, G. P., Modra, B. D., Tucker, T. A., & Cox, R. J. (2017). Vehicle stability testing for flood flows (WRL Technical Report 2017/07). UNSW Water Research Laboratory. DOI: 10.26190/unsworks/27416
2 Han, Z., & Sharif, H. O. (2021). Analysis of flood fatalities in the United States, 1959–2019. Water, 13(13), 1871. DOI: 10.3390/w13131871
3 How floodwaters can turn cars into death traps – UNSW Sydney – June 20, 2016
4 Social Media: Flood Safety – National Weather Service – accessed November 19, 2026

I’m a science journalist and researcher at The Watchers, contributing to the Epicenter edition, where I cover peer-reviewed scientific research and emerging discoveries across Earth and space sciences. With a background in astronomy and a passion for environmental science, I’ve worked in shark and coral conservation in Fiji, conducting reef and shark-behavior research, contributing to mangrove restoration, and earning PADI Open Water and Coral Reef Certifications. I bring a blend of scientific rigor and storytelling to illuminate the discoveries shaping our planet and beyond.
Published in the last 24 hours
- People who hid under an Oklahoma highway overpass from a 1999 tornado lost fingers, ears and noses, and three people died near or under overpasses that day Epicenter
- In January 1862, California’s new governor took a rowboat to his own inauguration, after 45 days of storms had turned the Central Valley into a lake up to 300 miles long Epicenter
- People who stayed put through the 2017 hurricanes were more often the ones with flood insurance, a survey of 2,557 Gulf Coast residents found, and the authors suggest the policy may have made the storm feel less dangerous Epicenter
- A Virginia park ranger was struck by lightning seven times and lived, even though three of the strikes set his hair on fire Epicenter
