
In January 1862, California’s new governor took a rowboat to his own inauguration, after 45 days of storms had turned the Central Valley into a lake up to 300 miles long
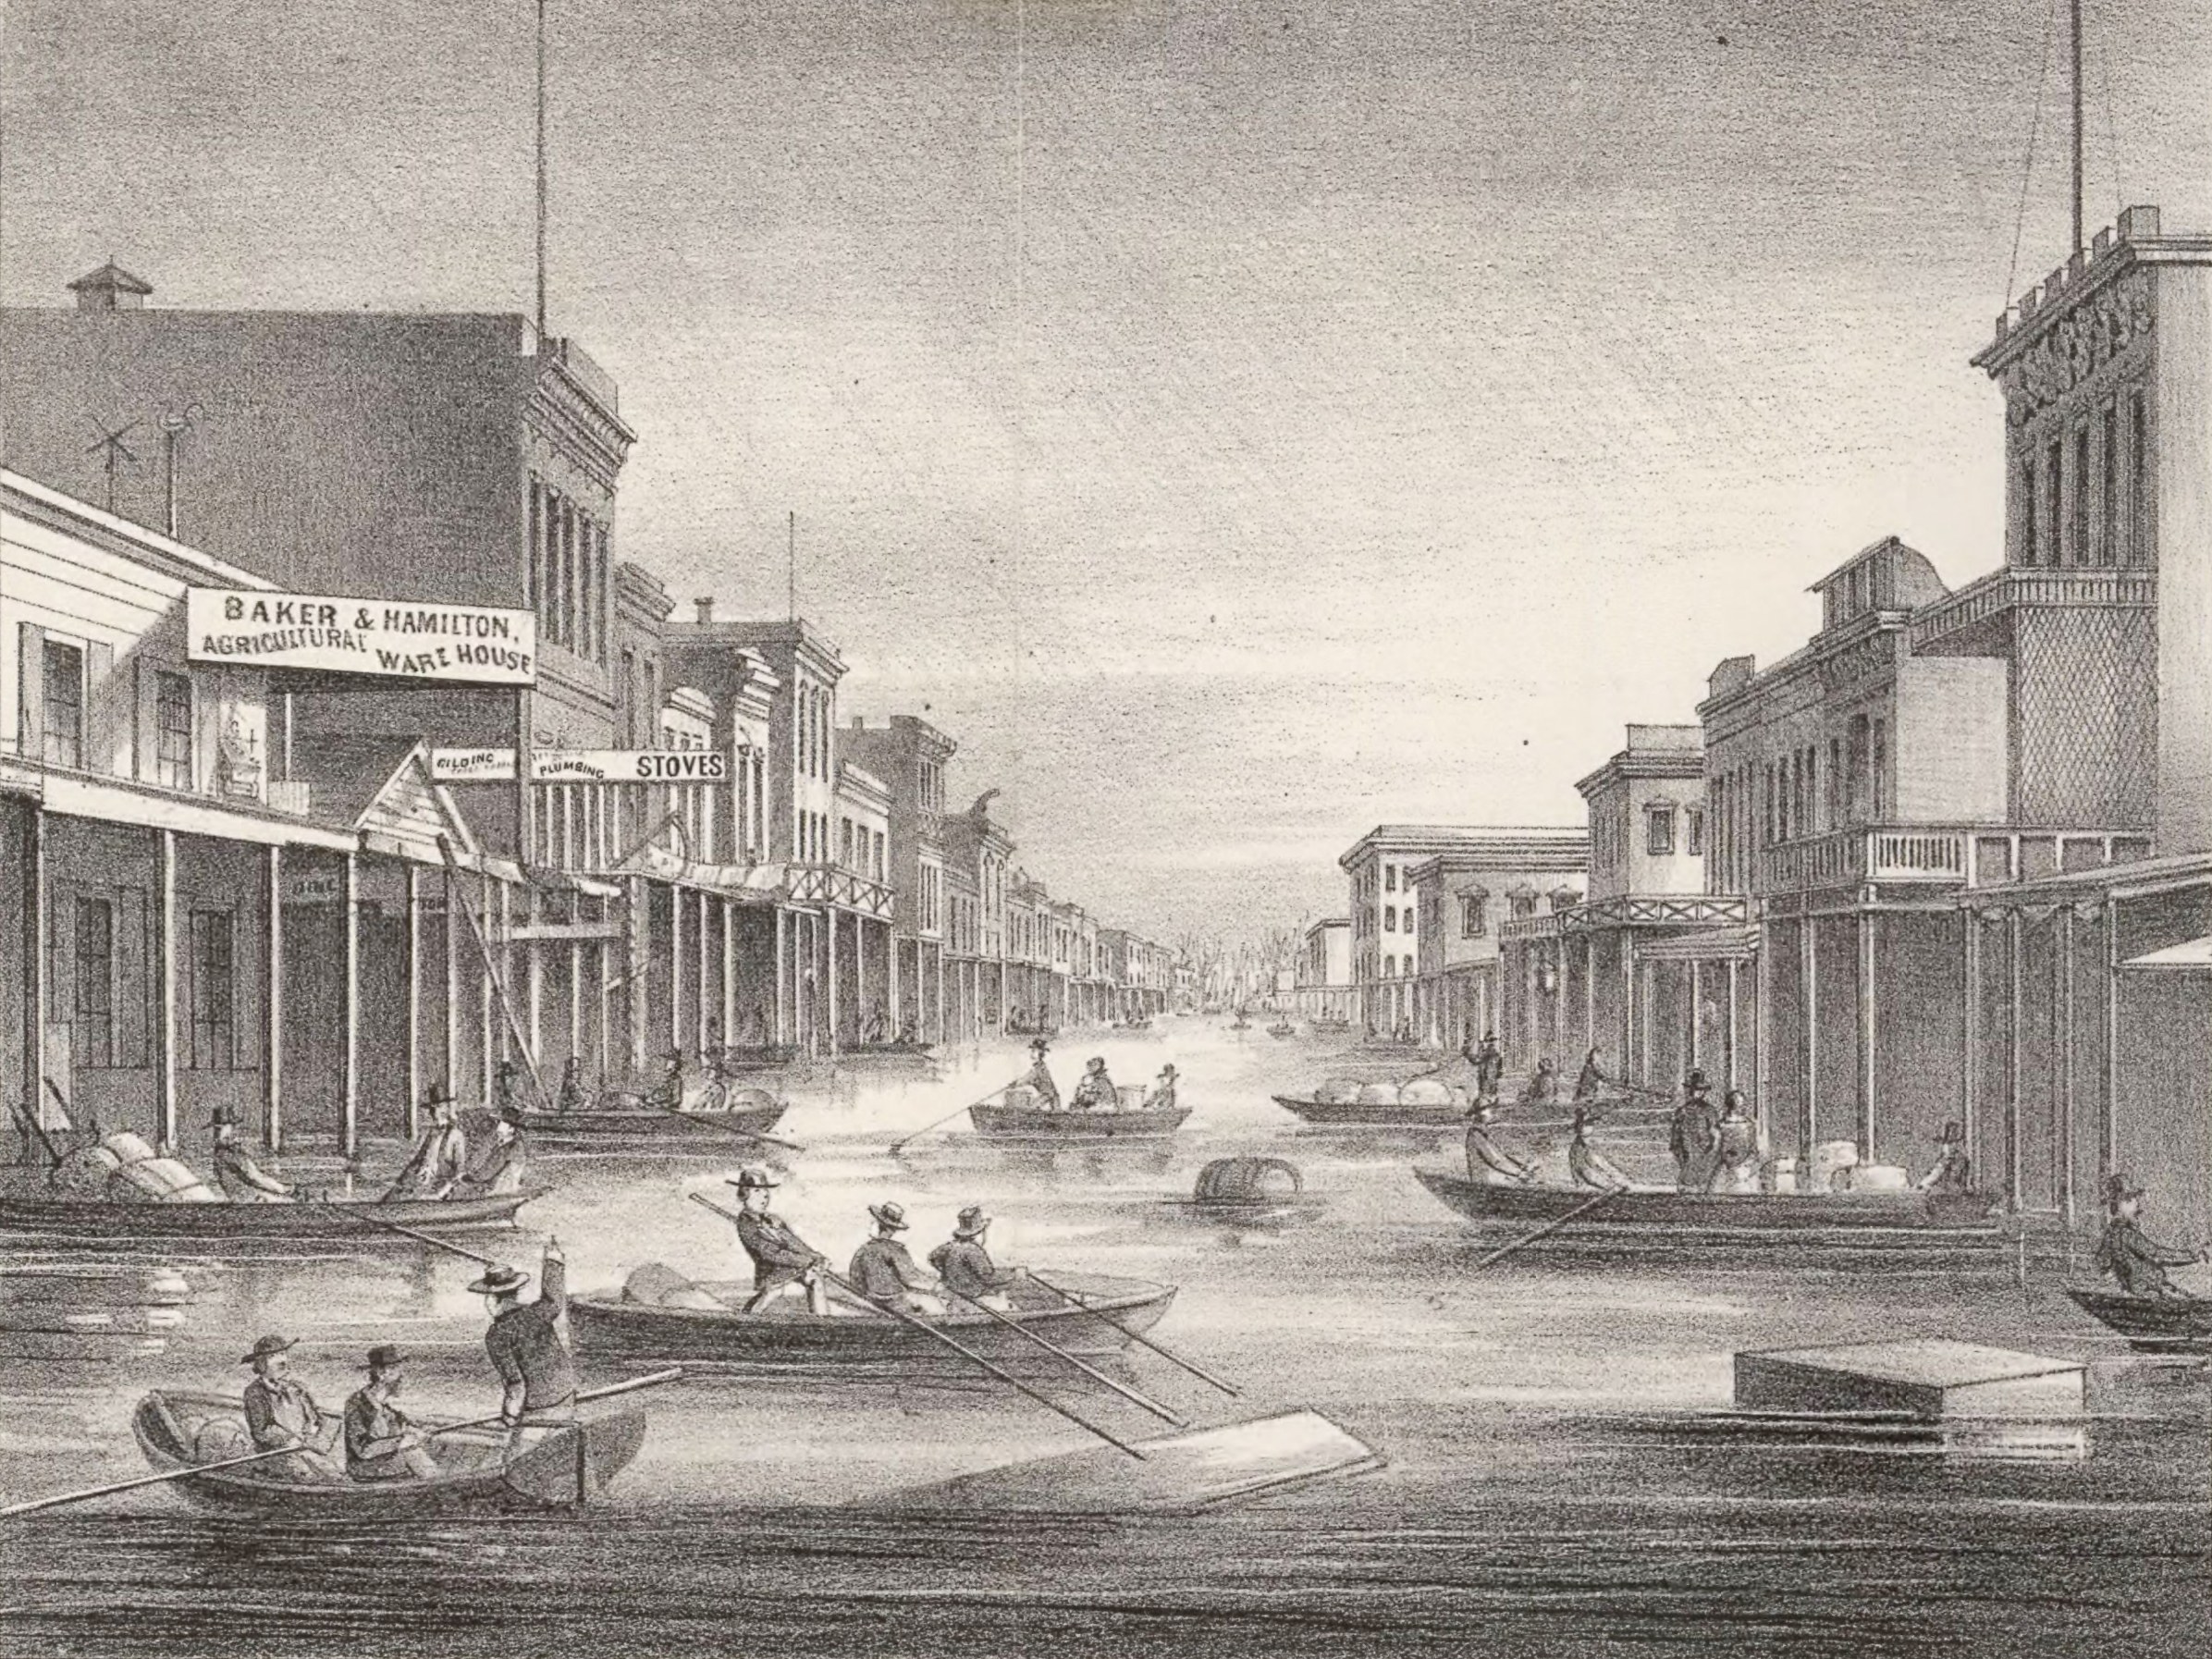
Stanford’s rowboat journey occurred during a much larger hydrometeorological disaster. California State Library records show that he delivered his inaugural address on January 10, 1862, while Sacramento was again experiencing severe flooding. California State Parks preserves the historical account that Stanford attended the ceremony by rowboat.
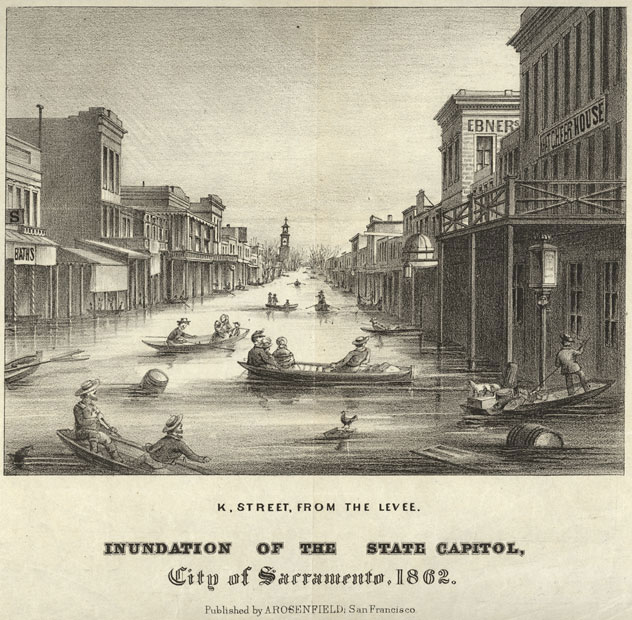
Nine days after the inauguration, Brewer recorded the regional scale of the inundation in a letter from San Francisco. He described the Sacramento and San Joaquin valleys as flooded across a region 402–483 km (250–300 miles) long and averaging at least 32 km (20 miles) wide. Brewer estimated the affected district at 12 950–15 540 km2 (5 000–6 000 mi2), while noting that the dimensions did not represent a uniform depth or width across the entire valley.
Brewer’s observations were written while the flood was still unfolding. He reported thousands of farms under water, livestock losses, residents leaving inundated districts and relief operations sending boats, clothing and prepared food toward Sacramento. His journal provides one of the strongest contemporary accounts of the disaster because the measurements and descriptions were recorded during the event rather than reconstructed from later retellings.
The exact duration of the storm sequence depends on how the event is defined. The U.S. Geological Survey describes California as being struck by successive storms for 45 days. Slinskey et al. (2023), writing in the Journal of Geophysical Research: Atmospheres, describe intense precipitation in Northern California over 43 days during one of the most prominent successive atmospheric-river episodes in the historical record.
A separate reconstruction by meteorologists Jan Null and Joelle Hulbert found that rain occurred somewhere in California on 28 of the 30 days from December 24, 1861 to January 21, 1862. The different figures use different temporal and geographic definitions, so about six weeks is the least ambiguous general description of the prolonged flood-producing sequence.
The rainfall accumulated on top of an already wet winter. Brewer wrote that San Francisco had received 832 mm (32.75 inches) between the first shower on November 6, 1861 and January 18, 1862, with rain still falling when he recorded the figure. At Sonora in the Sierra Nevada foothills, he reported about 1 829 mm (72 inches) between November 11 and January 14.
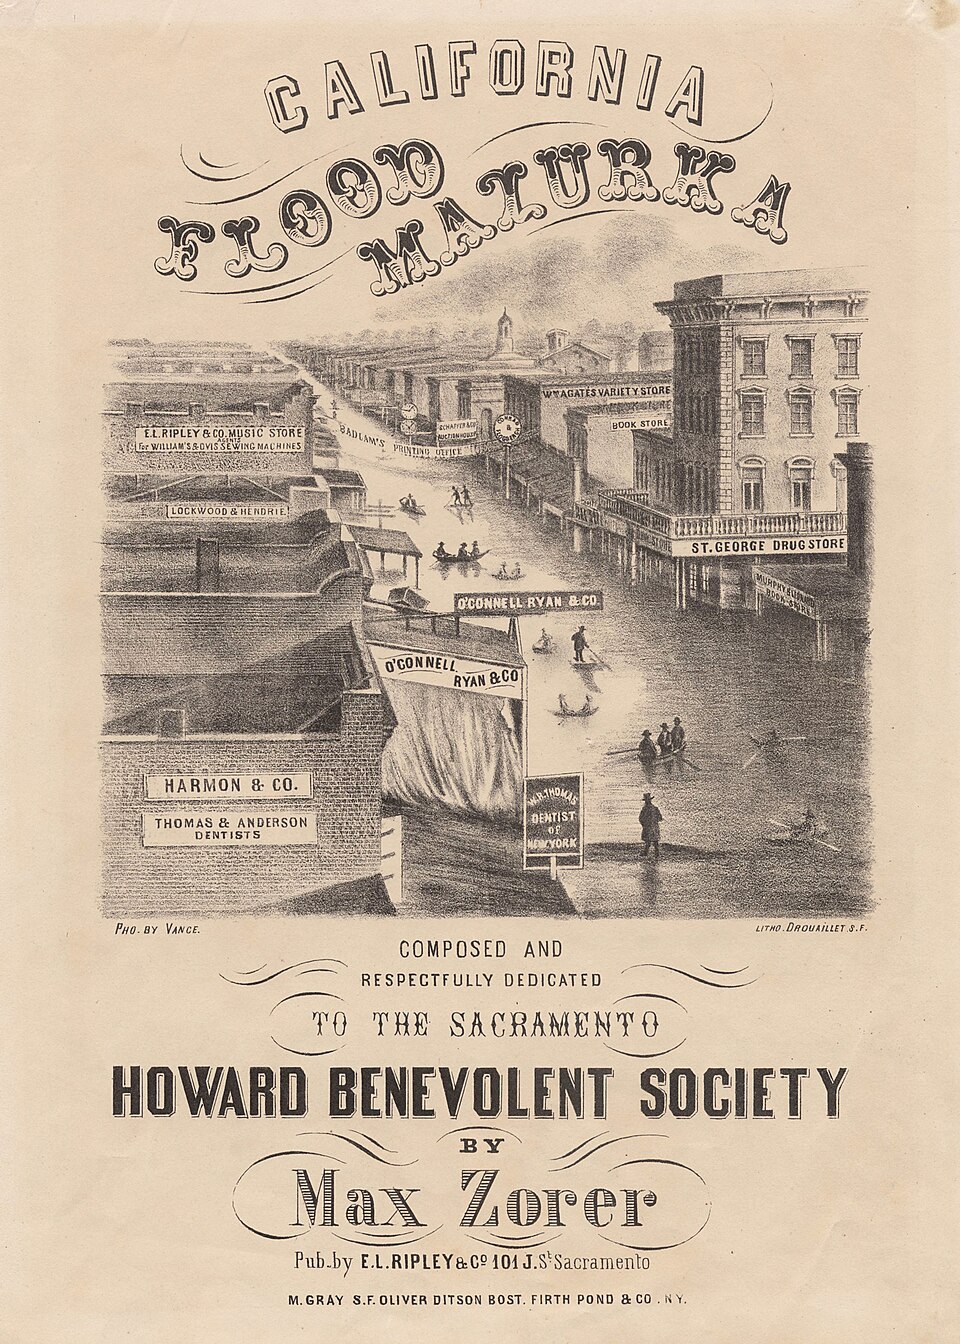
Reconstructed station observations show how widely the extreme precipitation extended. Null and Hulbert reported nearly 864 mm (34 inches) at San Francisco during December and January and more than 940 mm (37 inches) at Sacramento, including a one-day maximum near 102 mm (4 inches). Red Dog in Nevada County recorded about 279 mm (11 inches) in 24 hours.
The Sierra Nevada foothills received still larger totals. Sonora recorded more than 2 591 mm (102 inches) during December and January, while Nevada City observations were reported as snowfall equivalent to about 2 921 mm (115 inches) of rain for the storm period. Farther south, Los Angeles received nearly 889 mm (35 inches), showing that the prolonged wet pattern was not confined to the Sacramento basin.
Warm precipitation added another source of water. Null and Hulbert reported that warm rain produced unusual midwinter melting of Sierra Nevada snowpack, increasing runoff into rivers already carrying large storm flows. Slinskey et al. likewise describe the 43-day Northern California precipitation sequence as ending with a warm storm associated with catastrophic flooding in the Sacramento Valley.
Modern atmospheric science provides a physical framework for the sequence. Atmospheric rivers are long, relatively narrow corridors of concentrated water-vapor transport in the lower atmosphere. When several atmospheric rivers reach the same watershed in close succession, runoff from one storm can be followed by another before soils, rivers and reservoirs have recovered, allowing hydrologic impacts to compound.
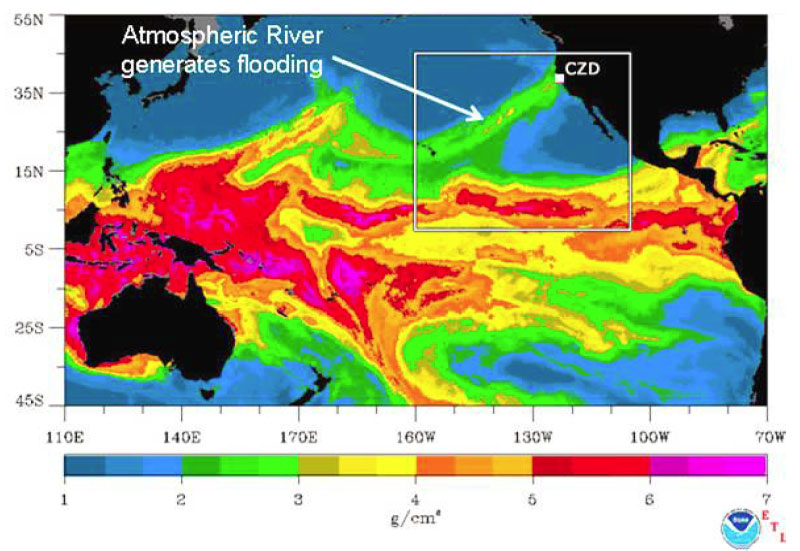
Slinskey et al. examined atmospheric-river clustering across the western United States using a 41-year record from 1979 to 2019. Their analysis found that atmospheric rivers cluster in time at greater-than-random rates across parts of the West, with especially frequent and long-lived clusters over Northern California. The study identifies successive atmospheric rivers as temporally compounding events because repeated storms can intensify impacts through soil saturation and reduced recovery time between events.
The 1861–62 sequence is cited in that research as a historical example of the hazard. It combined prolonged precipitation with a warm final storm and widespread flooding, illustrating the type of cumulative behavior that modern atmospheric-river clustering studies seek to quantify. The historical event itself predates satellites, radar and modern atmospheric reanalysis, so its storm structure is reconstructed from surface observations, historical records and later scientific interpretation rather than directly measured with present-day observing systems.
Sacramento was especially exposed because of its position near the Sacramento and American rivers and within the low-lying Sacramento Valley. Earlier earthen levees offered limited protection, and successive high-water episodes repeatedly inundated the city during the winter. Boats became a practical means of transportation through streets that normally carried carts, pedestrians and commercial traffic.
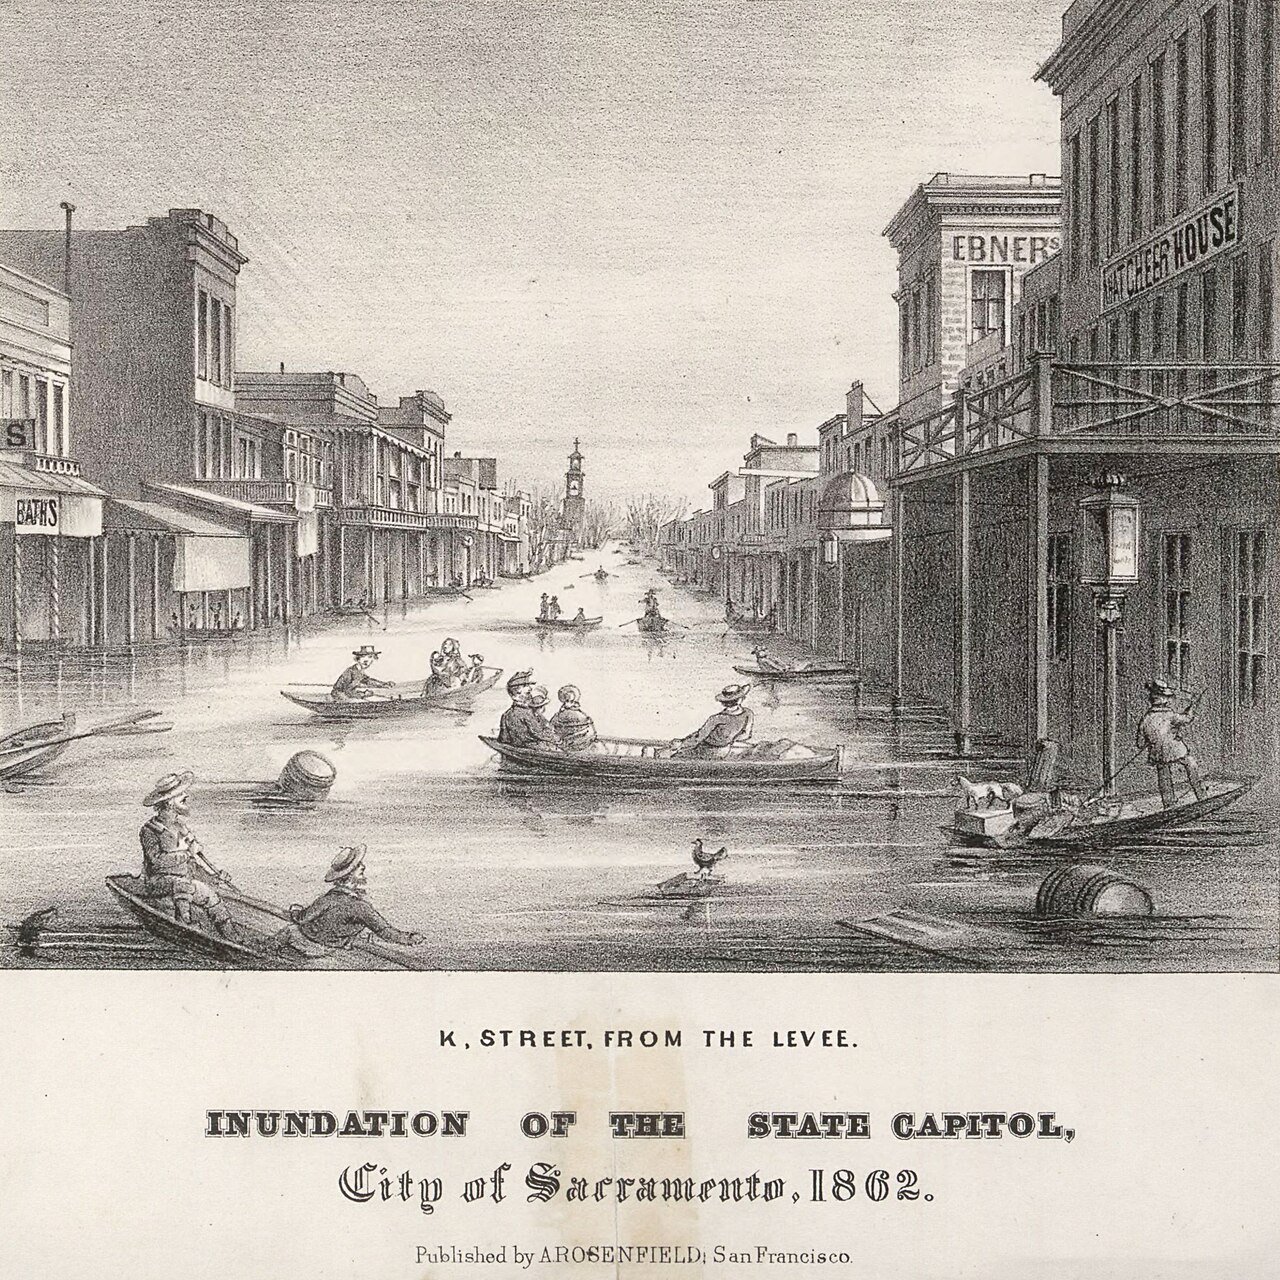
The flooding extended far beyond the capital. Brewer’s January 19 description covered both the Sacramento and San Joaquin valleys, and USGS characterizes the 1861–62 episode as a statewide sequence that produced severe flooding up and down California. The term “inland sea” describes the extraordinary continuity and scale of inundation reported across portions of the Central Valley; it should not be interpreted as a lake with a single shoreline or uniform depth.
Brewer continued to record flood effects after the January peak. His journal describes transportation problems, inundated farmland and large bodies of standing water across the valley. The surviving record shows that the disaster was not a single flood crest but the cumulative result of repeated storms, saturated landscapes, swollen rivers, snowmelt and successive inundation episodes.
The Great Flood later became an important historical reference for modern California disaster planning. USGS developed the ARkStorm scenario to examine what a scientifically plausible sequence of extreme winter storms could do to the far more populous and developed state that exists today. The scenario was informed by California’s history of extreme storms, including the 1861–62 disaster, but it is a constructed modern scenario rather than a reconstruction or forecast of the historical event.
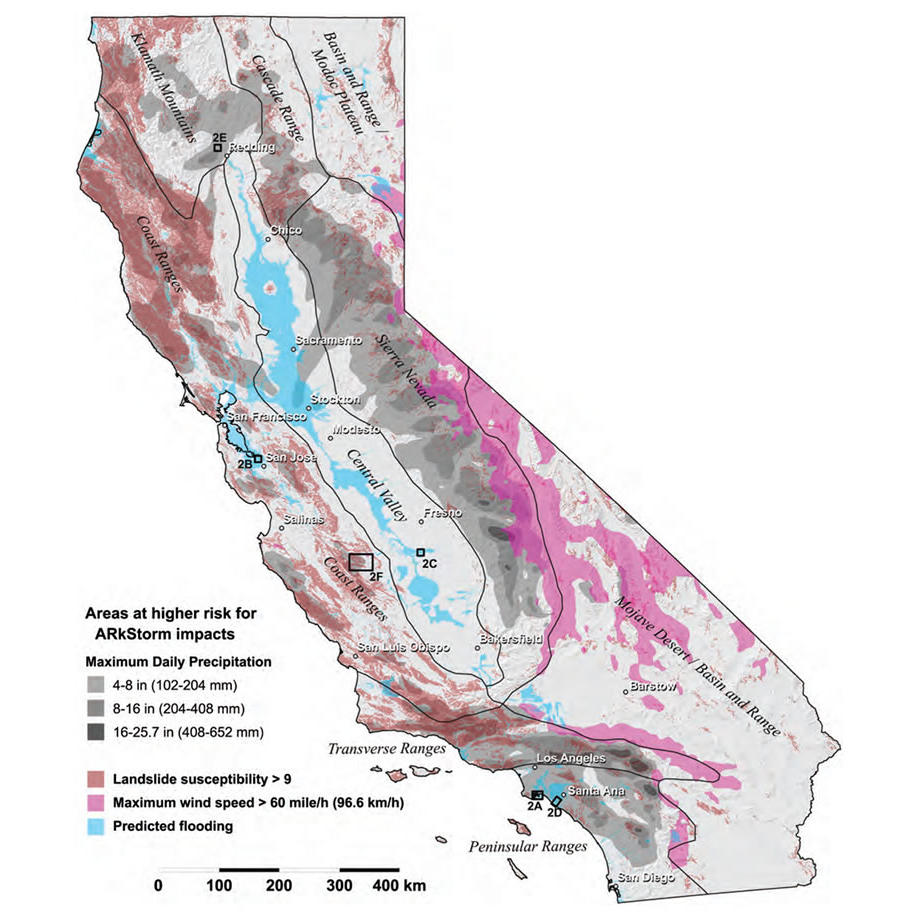
The ARkStorm map shows why the historical event remains relevant to hazard science. California’s Central Valley still contains extensive low-lying agricultural land, cities, transportation routes and flood-control infrastructure. A prolonged sequence of high-impact storms can therefore create interacting hazards that extend beyond rainfall itself, including river flooding, levee stress, landslides, transportation disruption and prolonged interruption of essential services.
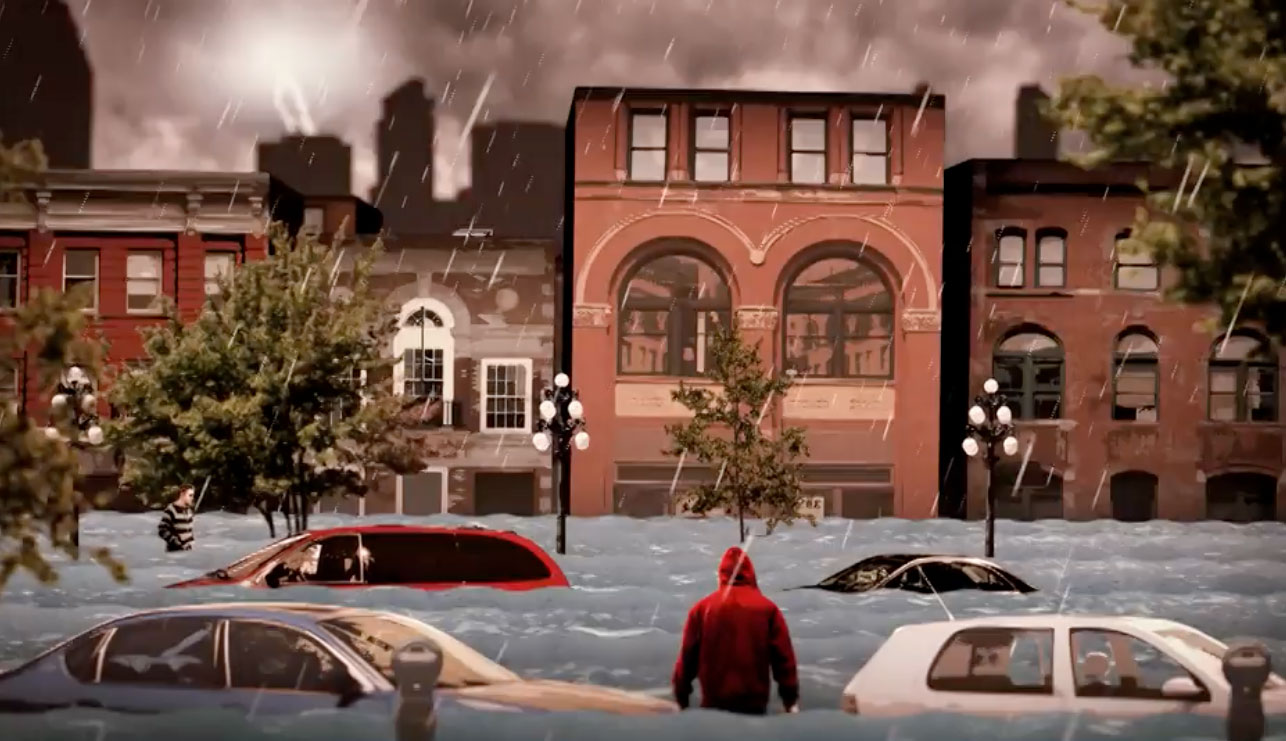
ARkStorm does not predict when another 1861–62-scale sequence will occur. Its purpose is to translate a physically plausible extreme-storm sequence into a modern emergency-planning scenario so that researchers and authorities can assess consequences to communities and infrastructure. Historical precedent establishes that prolonged extreme storm sequences have occurred in California; it does not provide a precise recurrence date for the next one.
January atmospheric rivers are part of the winter hydroclimate of western North America, but the 1861–62 episode was exceptional in persistence, precipitation and flood extent. Modern research shows that clusters of atmospheric rivers can produce cumulative impacts when storms arrive before watersheds recover, providing a scientific framework for understanding how a sequence of storms can become more damaging than isolated events.
Important historical uncertainties remain. Brewer’s 402–483 km (250–300 mile) estimate is an eyewitness description of the longitudinal scale of the flooded Sacramento and San Joaquin valleys, not a surveyed outline of a single continuous lake. Flood depths varied substantially by location, and surviving sources do not support treating a single depth as representative of the entire Central Valley.
A precise statewide death toll is also excluded from this draft. Later sources commonly repeat estimates running into the thousands, but the authoritative evidence reviewed for this article does not establish a sufficiently secure single number for that claim. The documented physical scale, rainfall, agricultural losses and disruption are substantial without adding an uncertain casualty total.
The strongest surviving evidence instead comes from the convergence of contemporary observations and modern science: Brewer documented a flooded region hundreds of kilometers long while the disaster was underway; Stanford’s rowboat inauguration records how the inundation disrupted the state capital; and modern atmospheric-river research explains how successive Pacific storms can accumulate into prolonged, high-impact flood episodes. More than a century and a half later, the Great Flood of 1862 remains a benchmark for understanding California’s exposure to extreme winter storm sequences.
References:
1 Brewer, W. H. (1930). Up and Down California in 1860–1864: The Journal of William H. Brewer (F. P. Farquhar, Ed.). Library of Congress
2 Null, J., & Hulbert, J. (2007). California Washed Away: The Great Flood of 1862. Weatherwise, 60(1), 26–30. DOI: 10.3200/WEWI.60.1.26-30
3 Slinskey, E. A., Hall, A., Goldenson, N., Loikith, P. C., & Norris, J. (2023). Subseasonal clustering of atmospheric rivers over the western United States. Journal of Geophysical Research: Atmospheres, 128, e2023JD038833. DOI: 10.1029/2023JD038833
4 ARkStorm: California’s Other “Big One” – U.S. Geological Survey – February 4, 2011
5 Leland Stanford inaugural address – California State Library – January 10, 1862
6 Victorian Society in America Preservation Award – California State Parks – historical record of Stanford attending his inauguration by rowboat

I’m a science journalist and researcher at The Watchers, contributing to the Epicenter edition, where I cover peer-reviewed scientific research and emerging discoveries across Earth and space sciences. With a background in astronomy and a passion for environmental science, I’ve worked in shark and coral conservation in Fiji, conducting reef and shark-behavior research, contributing to mangrove restoration, and earning PADI Open Water and Coral Reef Certifications. I bring a blend of scientific rigor and storytelling to illuminate the discoveries shaping our planet and beyond.
Published in the last 24 hours
- People who hid under an Oklahoma highway overpass from a 1999 tornado lost fingers, ears and noses, and three people died near or under overpasses that day Epicenter
- People who stayed put through the 2017 hurricanes were more often the ones with flood insurance, a survey of 2,557 Gulf Coast residents found, and the authors suggest the policy may have made the storm feel less dangerous Epicenter
- A Virginia park ranger was struck by lightning seven times and lived, even though three of the strikes set his hair on fire Epicenter
- The hole in the ozone layer over Antarctica was about twice the size of the US this year, and scientists say it would have been bigger still if ozone-eating chemicals were at their 2000 levels Epicenter
