
Strong, long duration, solar flare measuring M7.3 erupted from Region 2036
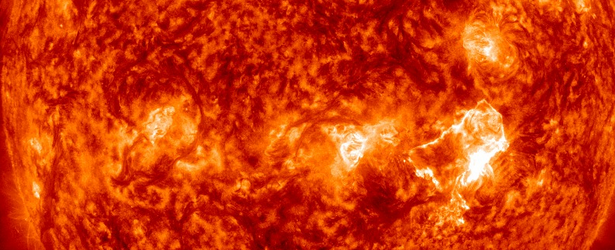
Image credit: NASA SDO AIA 304
A strong, long duration, solar flare measuring M7.3 erupted from Region 2036 on April 18, 2014. This event started at 12:31, peaked at 13:03 and ended at 13:20 UTC.
R2 Moderate radio blackout threshold was reached at 12:55 UTC – limited blackout of HF radio communication on sunlit side, loss of radio contact for tens of minutes. Degradation of low-frequency navigation signals for tens of minutes.
This region is still in geoeffective position and if CME was generated Earth directed component is very likely.
A 10cm Radio Burst lasting 24 minutes, with peak flux of 1000 sfu, was associated with the event. A 10cm radio burst indicates that the electromagnetic burst associated with a solar flare at the 10cm wavelength was double or greater than the initial 10cm radio background. This can be indicative of significant radio noise in association with a solar flare. This noise is generally short-lived but can cause interference for sensitive receivers including radar, GPS, and satellite communications.
Update:
The M7.3 was accompanied by a Tenflare (1000 sfu), a Castelli-U signature, as well as Type II (851 km/s) and Type IV radio emissions. An asymmetric halo CME was subsequently observed in SOHO/LASCO C2 coronagraph imagery at 13:25 UTC. Analysis suggested the ejecta was moving at approximately 1000 km/s and is Earth-directed.
Given the coronal mass ejection associated with this event and another observed on the 17th, the combined effects are expected to drive G1 (Minor) storming on the 20th and 21st. (SWPC)
Update #2:
Space Weather Message Code: WATA30
Serial Number: 111
Issue Time: 2014 Apr 19 1734 UTC
WATCH: Geomagnetic Storm Category G2 Predicted
Highest Storm Level Predicted by Day:
Apr 20: G2 (Moderate) Apr 21: G1 (Minor) Apr 22: None (Below G1)
THIS SUPERSEDES ANY/ALL PRIOR WATCHES IN EFFECT
Potential Impacts: Area of impact primarily poleward of 55 degrees Geomagnetic Latitude.
Induced Currents – Power grid fluctuations can occur. High-latitude power systems may experience voltage alarms.
Spacecraft – Satellite orientation irregularities may occur; increased drag on low Earth-orbit satellites is possible.
Radio – HF (high frequency) radio propagation can fade at higher latitudes.
Aurora – Aurora may be seen as low as New York to Wisconsin to Washington state.
***
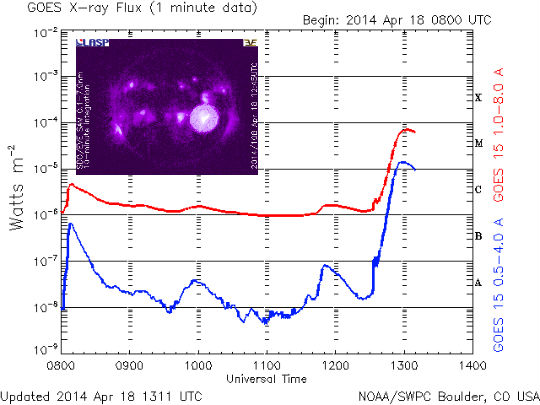
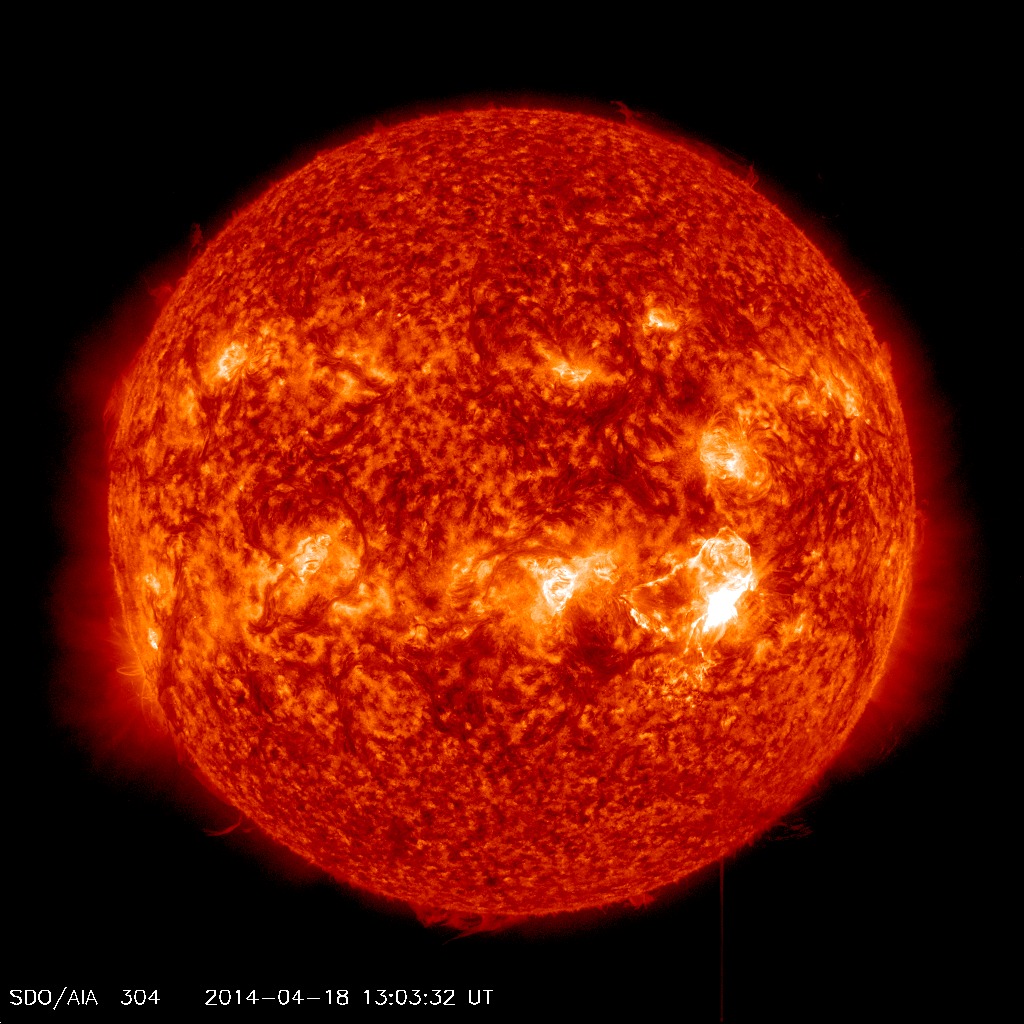
Image credit: NASA SDO / AIA 304
Space Weather Message Code: SUMXM5
Serial Number: 116
Issue Time: 2014 Apr 18 1323 UTC
SUMMARY: X-ray Event exceeded M5
Begin Time: 2014 Apr 18 1231 UTC
Maximum Time: 2014 Apr 18 1303 UTC
End Time: 2014 Apr 18 1320 UTC
X-ray Class: M7.3
Location: S18W34
NOAA Scale: R2 – Moderate
Potential Impacts: Area of impact centered primarily on sub-solar point on the sunlit side of Earth.
Radio – Limited blackout of HF (high frequency) radio communication for tens of minutes.
***
Space Weather Message Code: SUM10R
Serial Number: 615
Issue Time: 2014 Apr 18 1325 UTC
SUMMARY: 10cm Radio Burst
Begin Time: 2014 Apr 18 1243 UTC
Maximum Time: 2014 Apr 18 1255 UTC
End Time: 2014 Apr 18 1307 UTC
Duration: 24 minutes
Peak Flux: 1000 sfu
Latest Penticton Noon Flux: 179 sfu
Description: A 10cm radio burst indicates that the electromagnetic burst associated with a solar flare at the 10cm wavelength was double or greater than the initial 10cm radio background. This can be indicative of significant radio noise in association with a solar flare. This noise is generally short-lived but can cause interference for sensitive receivers including radar, GPS, and satellite communications.
***
Space Weather Message Code: WARPC0
Serial Number: 76
Issue Time: 2014 Apr 18 1412 UTC
WARNING: Proton 100MeV Integral Flux above 1pfu expected
Valid From: 2014 Apr 18 1412 UTC
Valid To: 2014 Apr 18 2100 UTC
Warning Condition: Onset
Potential Impacts: An enhancement in the energetic portion of the solar radiation spectrum may indicate increased biological risk to astronauts or passengers and crew in high latitude, high altitude flights. Additionally, energetic particles may represent an increased risk to all satellite systems susceptible to single event effects. This information should be used in conjunction with the current Solar Radiation Storm conditions when assessing overall impact.
***
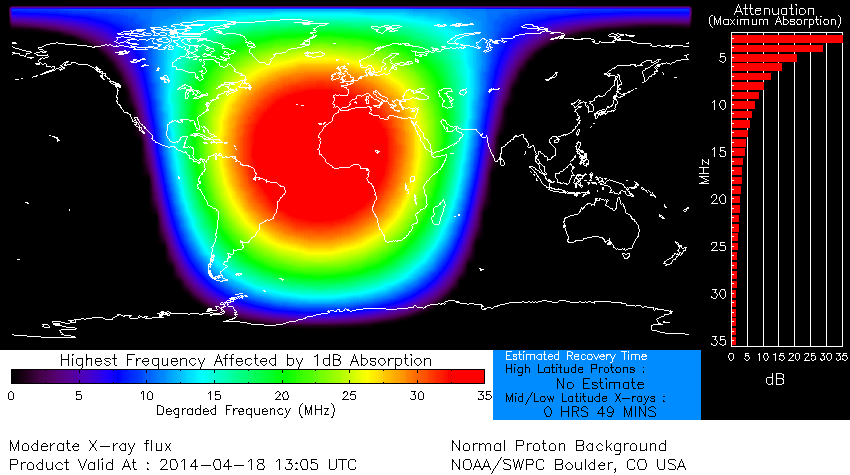
Global D-region absorption map. Absorption is the process by which energy in a radio wave passing through the ionosphere is converted to heat through electron collisions with other particles. For applications using frequencies above the VLF range, absorption predominately occurs in the D region.
Sunspots
There are currently 12 numbered sunspot regions on the disk.
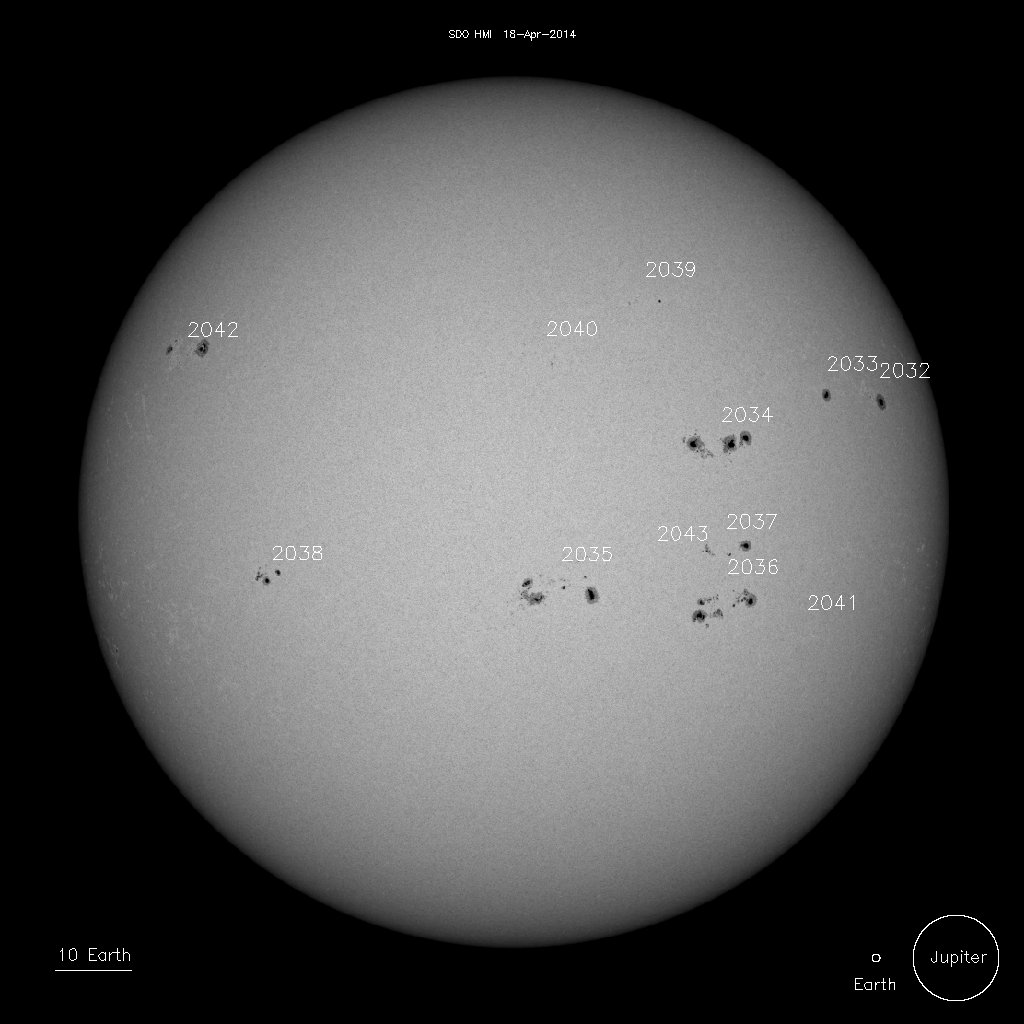
Sunspots on April 18, 2014. Image credit: NASA SDO / HMI
2032 N13W57 275 110 2 HAX 1 A
2033 N13W45 263 80 2 HSX 1 A
2034 N05W26 244 280 9 DHC 40 B
2035 S14W04 222 240 16 FSC 40 BG
2036 S15W28 246 510 9 DHC 34 BG
2037 S09W27 245 110 8 DAI 24 BG
2038 S13E37 181 50 2 CSO 6 B
2039 N25W17 223 10 3 BXO 5 B
2040 N16W02 228 10 9 BXO 14 B
2041 S19W43 261 10 2 BXO 5 B
2042 N18E54 165 240 9 DSO 4 B
2043 S11W17 235 10 2 BXO 2 B
NOAA SWPC forecasters estimate 60% chance of M-class, and 10 % chance of X-class solar flares in next three days.
I'm a dedicated researcher, journalist, and editor at The Watchers. With over 20 years of experience in the media industry, I specialize in hard science news, focusing on extreme weather, seismic and volcanic activity, space weather, and astronomy, including near-Earth objects and planetary defense strategies. You can reach me at teo /at/ watchers.news.
Can anyone ask the people at NASA if they still believe that the sun is in the beginning of minimum cycle. According to their opinion the Sun entered solar minimum in the end of the last year. Since 1989 almost all the predictions of solar physicists were wrong regarding both minimum and maximum cycles. The reason to me is quite obvious, but who will believe me? I cannot convince planet full of physicists. This is the sad reality