
Indo-Australian plate is breaking up along a new plate boundary
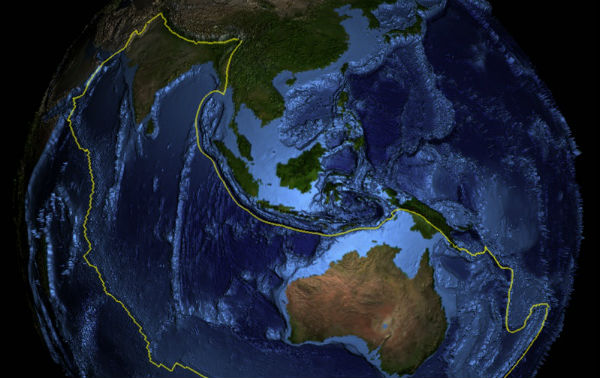
Image credit: http://jaeger.earthsci.unimelb.edu.au
Large earthquakes can alter seismicity patterns across the globe in very different ways, according to two new studies by seismologists from the University of California, Berkeley, and the U.S. Geological Survey (USGS). Two new analysis shed light on more than a decade of debate on the origin and prevalence of triggered seismicity and remote aftershocks.
Researchers analyzed the unprecedented increase in global seismic activity triggered by the M8.6 earthquake that struck in East Indian Ocean on April 11, 2012, and the near-cessation of seismic activity up to 250 miles away caused by the 2004 M9.2 Sumatra earthquake. The East Indian Ocean event was the largest strike-slip earthquake ever recorded. The the most famous strike-slip fault is probably the San Andreas in US.

The earthquake off the coast of northern Sumatra in Indonesia began with a sudden shift in a strike-slip fault, a line of weakness in the sea floor where two huge bodies of rock can slide past one another. Unlike the earthquake that triggered the devastating 2004 tsunami in the region, the sea floor moved sideways instead of vertically, meaning it displaced less water and did not send giant waves around the Indian Ocean.


The slippage occurred in a fracture in a slab of oceanic crust that is bending downwards and beneath Sumatra. The US geological survey said the main shock was magnitude 8.6, which is extraordinarily high for a strike-slip fault. Two hours after the main shock was felt, the area was hit by a magnitude-8.2 aftershock, probably caused by slippage along the same 125-mile fault. The huge release of energy redistributed stress to other weak spots in the crust, making them more likely to cause future earthquakes.

This events provided one of the best evidence yet that the vast Indo-Australian plate is being torn in two, according to New Scientist. The events suggest that the Indo-Australian plate is breaking up along a new plate boundary, say the researchers, and that may account for both the location and the size of April’s quakes
According to Roland Burgmann (professor of earth and planetary science at UC Berkeley and coauthor of the study), M8.6 and an M8.3 that followed were in a very diffuse zone in an oceanic plate close to the Sumatra subduction zone, but it wasn’t a single fault that produced the quake, it was a crisscrossing of three or four faults that all ruptured in sequence to make such a big earthquake, and they ruptured deep. The seismologists analysis found five times the expected number of quakes during the six days following the April 11 quake and aftershock.
") Some 380 seconds into the greatest earthquake to rupture since 1960, the simulated dynamic Coulomb stress waves (red-blue) shed continuously off the 2004 M=9.2 Sumatra rupture front can be seen sweeping through the Andaman Sea, where faults remarkably shut down for the next five years. Earthquakes since 1964 are shown as black dots, and the Sunda trench along which the 1400-km-long earthquake occurred is the arcuate black line on the left (west). Sumatra is on the right, and Myanmar/Burma is at top. Sevilgen et al (Proc. Nat. Acad. Sci, 2012) find that despite the magnitude of these dynamic stress waves, the much smaller permanent stresses account for the change in seismicity after the main shock. (This graphic accompanies the Sept. 3, 2012 article in Proceedings of the National Academy of Sciences by Volkan Sevilgen, Ross Stein and Fred Pollitz.)
Some 380 seconds into the greatest earthquake to rupture since 1960, the simulated dynamic Coulomb stress waves (red-blue) shed continuously off the 2004 M=9.2 Sumatra rupture front can be seen sweeping through the Andaman Sea, where faults remarkably shut down for the next five years. Earthquakes since 1964 are shown as black dots, and the Sunda trench along which the 1400-km-long earthquake occurred is the arcuate black line on the left (west). Sumatra is on the right, and Myanmar/Burma is at top. Sevilgen et al (Proc. Nat. Acad. Sci, 2012) find that despite the magnitude of these dynamic stress waves, the much smaller permanent stresses account for the change in seismicity after the main shock. (This graphic accompanies the Sept. 3, 2012 article in Proceedings of the National Academy of Sciences by Volkan Sevilgen, Ross Stein and Fred Pollitz.)
The authors investigated two possible causes for the changes in remote seismicity rates: the dynamic stresses imparted by the main shock rupture, which best explain the global triggering in the April 2012 quake case; and the small but permanent stress changes, which best explain this one. The authors found that the main shock brought the transform fault segments about ¼ bar of pressure farther from static failure, and the rift segments about ¼ bar closer to static failure (for comparison, car tires are inflated with about 3 bars of pressure), which matches the seismic observations.
 Remote earthquakes in the six days preceding (top) and the six days following (bottom) the M=8.6 main shock in the East Indian Ocean on April 11, 2012. The color scale indicates seismic stress, with purple = zero and red = high. (This graphic accompanies the September 2012 article in Nature by Fred Pollitz)
An extraordinary number of strong earthquakes were triggered worldwide for a week after M8.6 earthquake. Main shock that generated stresses in Earth’s crust triggered large and potential damaging earthquakes and it took three hours for seismic waves to travel through Earth’s crust. However, the rate of global quakes during the preceding 6-12 days was extremely low. East Indian Ocean quake was a “strike-slip” quake that more effectively generates waves (called Love waves) that travel just under the surface and are energetic enough to affect distant fault zones.
Instead of old definition of aftershocks as smaller earthquakes that happen after the main fault rupture, researchers give new view as aftershocks are simply earthquakes of any size and location that would not have taken place had the main shock not struck.
 Number of earthquakes at least M=5.5 in the eight days preceding and the eight days following the M=8.6 main shock in the East Indian Ocean on April 11, 2012. (This graphic accompanies the September 2012 article in Nature by Fred Pollitz )
“Earthquakes are immense forces of nature, involving complex rock physics and failure mechanisms occurring over time and space scales that cannot be recreated in a laboratory environment,” USGS Director Marcia McNutt.
While global triggering of large aftershocks appears very rare, regional triggering is common and important to understand for post-main shock emergency response and recovery. These findings are a warning to those living in seismically active regions worldwide that the risk from a large earthquake could persist – even on the opposite side of the globe – for more than a few hours.
 A map of the Indian Ocean region shows boundaries of Earth’s tectonic plates in the area, and the epicenters (red stars) of two great earthquakes that happened April 11, 2012. (Credit: Keith Koper, University of Utah Seismograph Stations)
Sources: USGS, Seismicity.net, NewScientist, Nature, PNAS, Our Amazing Planet
Commenting rules and guidelines
We value the thoughts and opinions of our readers and welcome healthy discussions on our website. In order to maintain a respectful and positive community, we ask that all commenters follow these rules.