
97% of the Greenland’s ice sheet surface melted in mid-July
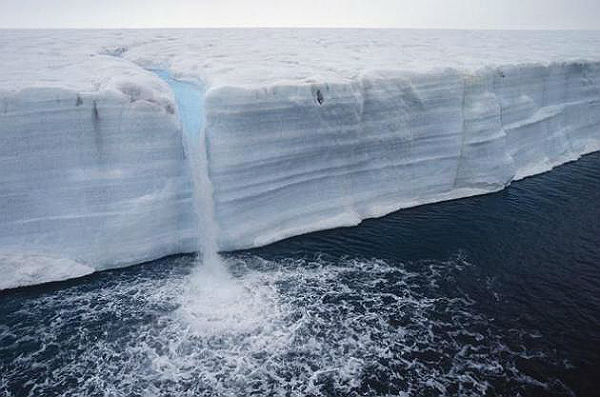
Image credit: Jan Tuve Johanson
Greenland’s surface ice cover melted over a larger area than at any time in more than 30 years of satellite observations in period of merely few days this month. Nearly the entire ice cover of Greenland, from its thin, low-lying coastal edges to its two-mile-thick center, experienced some degree of melting at its surface, according to measurements from three independent satellites analyzed by NASA and university scientists. Satellite data reveals an estimated 97% of the ice sheet surface thawed at some point in mid-July. Researchers have not yet determined whether this extensive melt event will affect the overall volume of ice loss this summer and contribute to sea level rise.
This event, combined with other natural but uncommon phenomena, such as the large calving event last week on Petermann Glacier, are part of a complex story according to Tom Wagner, NASA’s cryosphere program manager in Washington. This extreme melt event coincided with an unusually strong ridge of warm air, or a heat dome, over Greenland. The ridge was one of a series that has dominated Greenland’s weather since the end of May with each successive ridge stronger than the previous one.

Even the area around Summit Station in central Greenland, which at about 3,2 km (2 miles) above sea level is near the highest point of the ice sheet, showed signs of melting. Such pronounced melting at Summit and across the ice sheet has not occurred since 1889, according to ice cores analyzed by Kaitlin Keegan at Dartmouth College in Hanover, N.H. A National Oceanic and Atmospheric Administration weather station at Summit confirmed air temperatures hovered above or within a degree of freezing for several hours July 11-12. However, ice cores from Summit show that melting events of this type occur about once every 150 years on average. With the last one happening in 1889, this event is right on time according to Lora Koenig, a Goddard glaciologist and a member of the research team analyzing the satellite data. But she also points that if we continue to observe melting events like this in upcoming years, it will be worrisome.
About half of the surface of Greenland’s ice sheet melts every summer. It is natural process. At high elevations, most of that melt water quickly refreezes in place. Some of the melt water is retained by the ice sheet near the coast and the rest is lost to the ocean. Researchers have not yet determined whether this extensive melt event will affect the overall volume of ice loss this summer and contribute to sea level rise.

In July 2012, a massive ice island broke free of the Petermann Glacier in northwestern Greenland. On July 16, the giant iceberg could be seen drifting down the fjord, away from the floating ice tongue from which it calved. Similar surface cracks appear on both the Petermann Glacier and the newly formed ice island. Ted Scambos of the National Snow and Ice Data Center observed melt ponds on the iceberg surface, but stated that the Petermann calving was likely associated with ocean currents rather than surface melt.
Nearly two years ago in July 2010, another large iceberg calved from the Petermann Glacier. That iceberg was estimated at roughly 251 square kilometers (97 square miles). The 2012 iceberg is estimated to be about half as big. This latest calving occurred farther upstream on the Petermann, but nevertheless occurred along a rift that appeared in satellite imagery in 2001.

SATELLITE DATA
At first, preliminary data puzzled researchers and scientist. Son Nghiem of NASA’s Jet Propulsion Laboratory in Pasadena, Calif., was analyzing radar data from the Indian Space Research Organisation’s (ISRO) Oceansat-2 satellite last week when he noticed that most of Greenland appeared to have undergone surface melting on July 12. This was so extraordinary event that at firsthe questioned the result: was this real or was it due to a data error? Nghiem then consulted with Dorothy Hall at NASA’s Goddard Space Flight Center in Greenbelt, Md. (Hall studies the surface temperature of Greenland using the Moderate-resolution Imaging Spectroradiometer (MODIS) on NASA’s Terra and Aqua satellites) She confirmed that MODIS showed unusually high temperatures and that melt was extensive over the ice sheet surface. Thomas Mote, a climatologist at the University of Georgia, Athens, Ga; and Marco Tedesco of City University of New York also confirmed the melt seen by Oceansat-2 and MODIS with passive-microwave satellite data from the Special Sensor Microwave Imager/Sounder on a U.S. Air Force meteorological satellite.
Watch Greenland’s ice sheet in real-time
Sources: NASA Science, National Snow and Ice Data Center, Earth Observatory, SAGE
and this happens approximately every 150 years or so, so it is both Normal and Cyclical. Instead of a ‘normal and cyclical’ headline, we find global warming fear mongering in the press….. how damn typical! http://wattsupwiththat.com/2012/07/24/greenland-ice-melt-every-150-years-is-right-on-time/
^ Amen, that and a stronger than normal solar maximum