
Rare high-resolution observations of a flare-prolific solar active region
A new mosaic from the GREGOR solar telescope shows the last 30 minutes before a major solar flare, displaying how twisted magnetic filaments and sunspot rotation stressed the solar magnetic field until it released an X1.2 eruption on November 10, 2025.

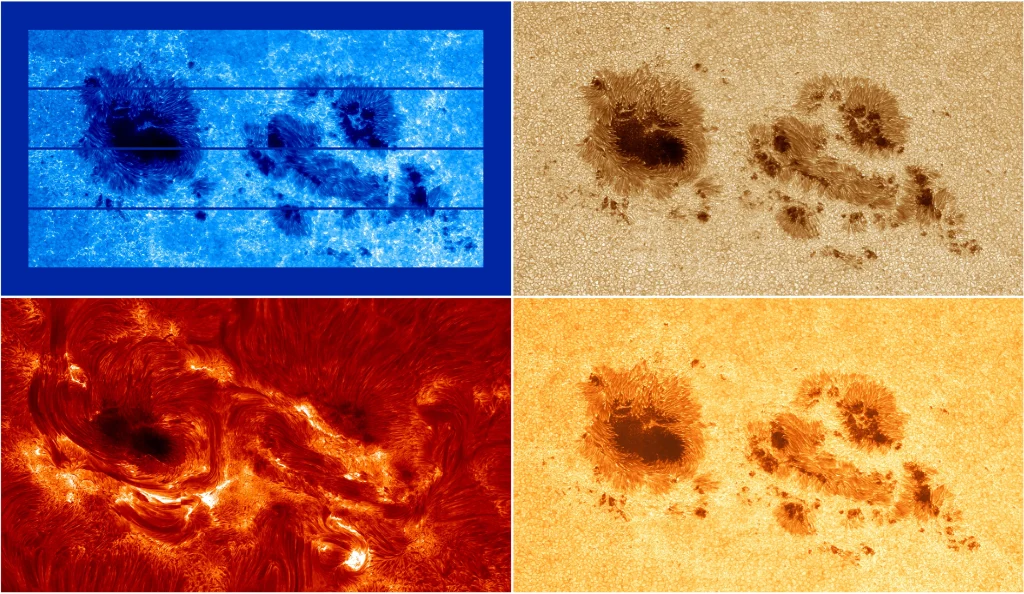
Active region NOAA 14274 at around 08:33 UTC, about 30 minutes before an X1.2 flare began on November 10, 2025. Credit: Carsten Denker et al 2025 Res. Notes AAS 9 321
Magnetic tension before the flare
Active region NOAA 14274 produced several powerful eruptions during early November 2025, including an X1.2 flare on November 10 and an even stronger X5.1 flare the following day.
Researchers from the Leibniz Institute for Astrophysics Potsdam used the 1.5 m GREGOR telescope at the Teide Observatory in Tenerife to obtain the first large-scale mosaic of the region before the flare. Using the High-resolution Fast Imager (HiFI+), the team assembled a high-resolution field of view 240 arcseconds by 150 arcseconds–roughly 175 000 x 110 000 km (109 000 x 68 000 miles) on the solar surface.
Observing the region at the highest resolution
The HiFI+ instrument recorded images in multiple spectral channels, including Ca II H (396.8 nm), TiO (705.8 nm), and broad- and narrow-band Hα (656.3 nm). Each image sequence consisted of 500 frames acquired at 100 Hz, producing 84 datasets from 28 telescope pointings. The 100 best frames per sequence were selected for speckle reconstruction using the Kiepenheuer Institute Speckle Imaging Package (KISIP).
The resulting mosaic represents one of the largest high-spatial-resolution solar maps produced with a ground-based telescope. Each raster step corresponds to 30 seconds of observation, giving a total acquisition time of about 14 minutes–an interval short enough to capture the pre-flare state with minimal temporal distortion.
Structure of an unstable active region
At the time of observation, NOAA 14274 showed a complex βγδ magnetic configuration. The trailing sunspot displayed tightly curved penumbral filaments, almost tangential to the umbra in its southern section, where several small parasitic polarities disrupted the penumbral magnetic pattern. The leading part of the region had braided filaments that appeared to interweave like submerged bundles, suggesting intense shear motion along the polarity inversion line (PIL).
Such shear and sunspot rotation can stress coronal field lines and build up magnetic free energy. When that stress exceeds the local threshold for stability, reconnection occurs–releasing stored magnetic energy in the form of flares and coronal mass ejections (CMEs).
Early signatures of energy release
The first signs of magnetic instability appear in the GREGOR images as small brightenings only a few tenths of an arcsecond wide–approximately 150 km (93 miles) on the Sun–tracing the edges of penumbral filaments in the trailing sunspot. These brightenings appeared about 30 minutes before the X1.2 flare onset.
Activity was initially concentrated in the western penumbra of the trailing spot, before propagating southward along a filament wrapping around the same structure.
Narrow Hα line-core brightenings were visible even before the flare’s official start time at 08:55 UTC. Within 20 minutes, the northern leading spot also became active, marking a shift in energy distribution across the region.
From flare ribbons to post-flare loops
At the flare’s maximum, recorded by space-based monitors at 09:19 UTC, emission ribbons extended through the umbra of the trailing sunspot and the adjacent Hα moss region to the south. These ribbons mark the footpoints of newly reconnected magnetic loops.
By 09:17 UTC, the first post-flare arches appeared, connecting the moss region to the trailing spot–a configuration typical of energy release through magnetic reconnection.
The evolution recorded by GREGOR and subsequent space observations provides a rare temporal link between the small-scale brightenings that precede flares and the larger magnetic restructuring that follows.
Implications for pre-flare diagnostics
Understanding how magnetic stress manifests in photospheric structures is key to predicting solar flares. High-resolution imaging at this scale helps bridge the gap between coronal magnetic models and the observable fine structure in sunspot filaments.
The observations from NOAA 14274 show that flare precursors can occur on scales smaller than 0.3 arcseconds–close to 200 km (125 miles)–and may evolve within minutes.
While space-based instruments continuously monitor large-scale solar dynamics, telescopes such as GREGOR provide the fine spatial detail necessary to connect magnetic topology to the timing of energy release. The combination of ground-based mosaicking and speckle restoration now allows entire active regions to be studied at resolutions once limited to single sunspots.
References:
1 The Calm before the Storm: High Spatial Resolution Mosaic of Active Region NOAA 14274 at the Onset of an X1.2 Flare – Carsten Denker et al – RNAAS – DOI 10.3847/2515-5172/ae230b

I am an Assistant Editor and Severe Weather & Science Journalist at The Watchers, specializing in real-time severe weather coverage, geophysical event reporting, and research-driven scientific analysis. You can reach me at rishav(at)watchers(.)news.
Commenting rules and guidelines
We value the thoughts and opinions of our readers and welcome healthy discussions on our website. In order to maintain a respectful and positive community, we ask that all commenters follow these rules.