
20 years after Hurricane Katrina: What has changed in forecasting and preparedness
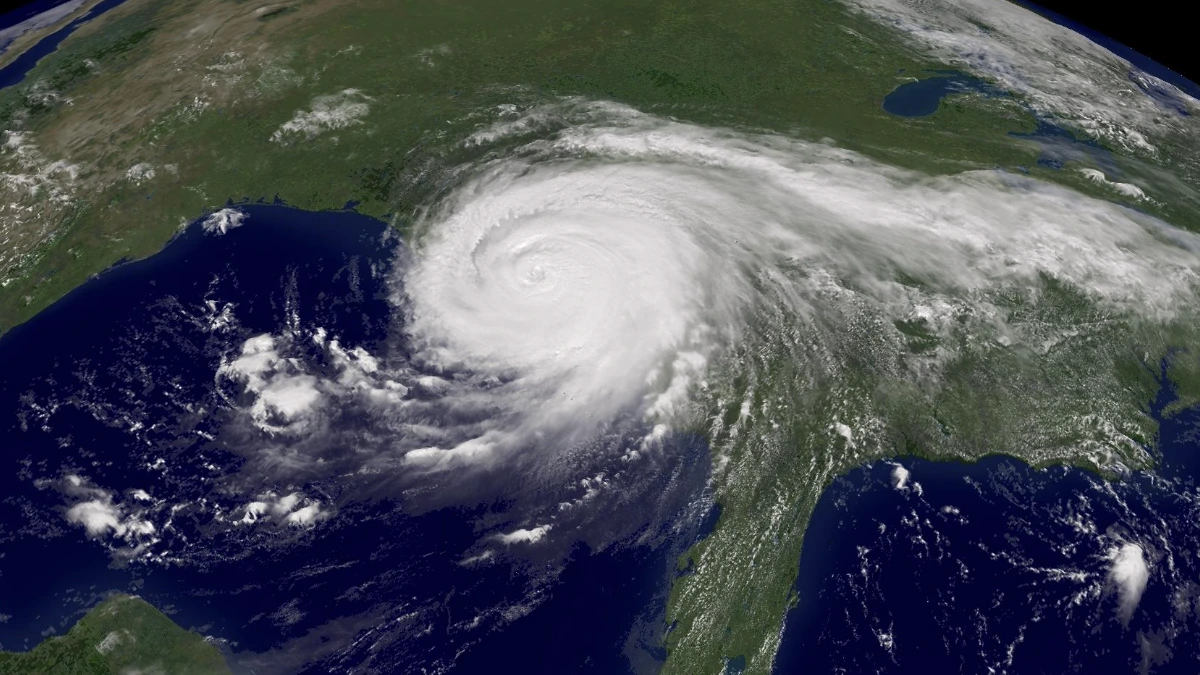
Hurricane Katrina, one of the deadliest and costliest hurricanes in U.S. history, devastated the Gulf Coast in August 2005, leaving nearly 2 000 dead and causing over USD 100 billion in damages.
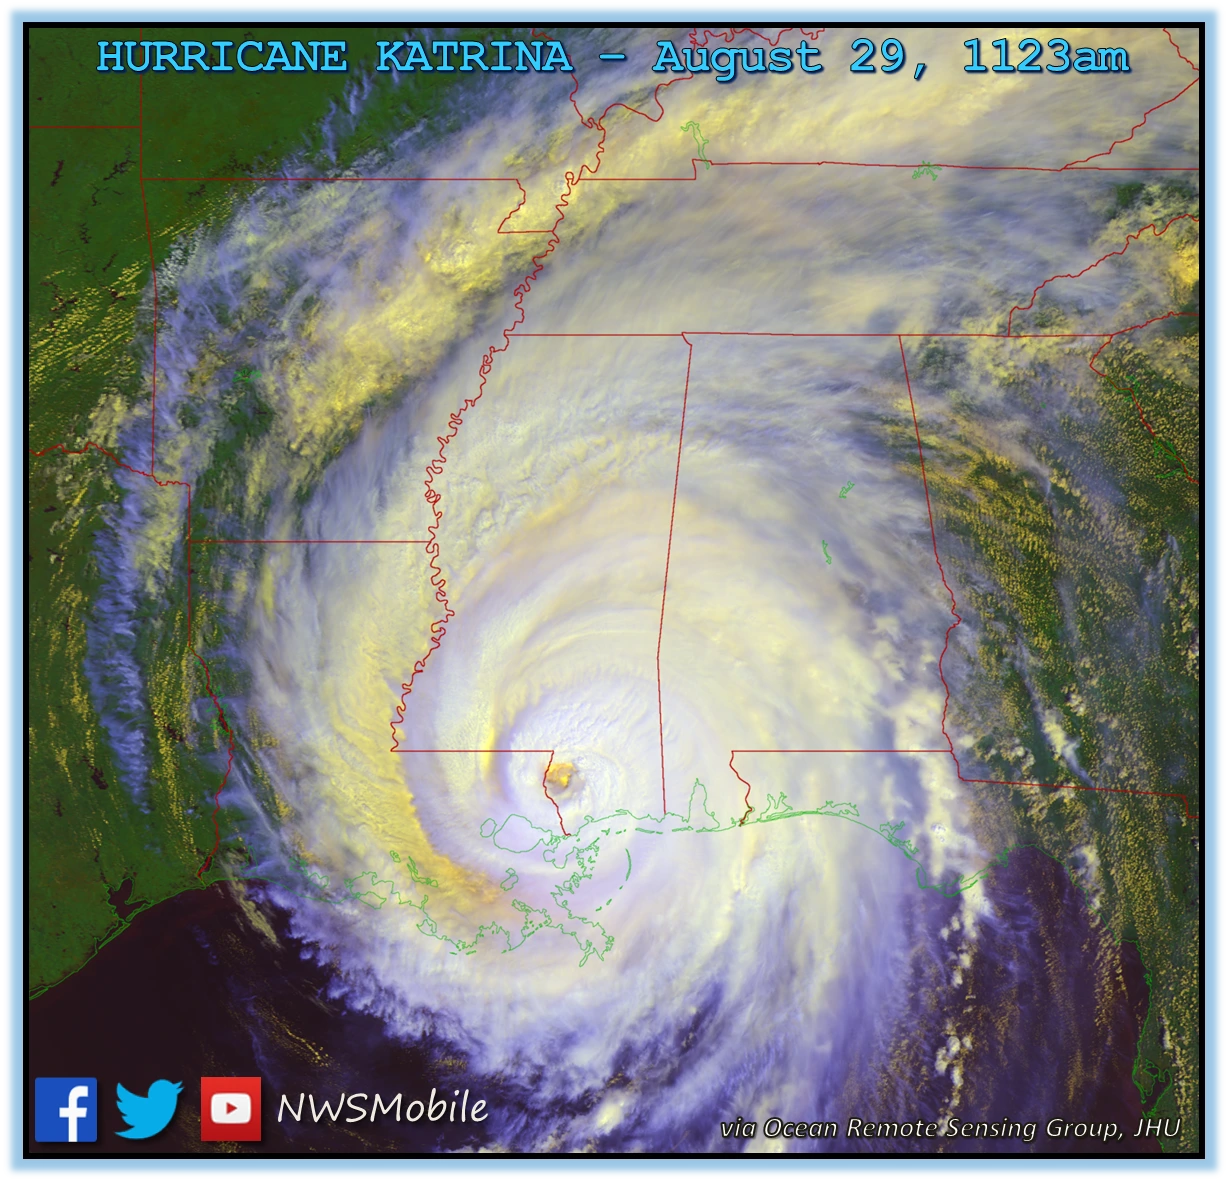
Satellite image of Hurricane Katrina on August 29, 2005. Credit: NOAA/GOES-12
Originating as a tropical depression in the Bahamas on August 23, Katrina rapidly intensified into a Category 5 hurricane in the Gulf of Mexico. Making landfall in Florida, Louisiana, and Mississippi, Katrina unleashed catastrophic storm surge, and flooded 80% of New Orleans causing levee failures, and destructive winds across the Southeast.
The storm exposed critical forecasting limitations of the time and reshaped U.S. disaster preparedness, standing as a benchmark for how hurricanes are tracked, predicted, and remembered.
Timeline
- 21:00 UTC on August 23 – Tropical Depression Twelve forms about 320 km (200 miles) southeast of Nassau, Bahamas.
- 12:00 UTC on August 24 – TD12 strengthens into Tropical Storm Katrina over the central Bahamas.
- 21:00 UTC on August 25 – Katrina intensifies into Category 1 hurricane just offshore Fort Lauderdale, Florida.
- 22:30 UTC on August 25 – Makes first landfall between Hallandale Beach and North Miami Beach, Florida, as a Category 1 hurricane with sustained winds of 130 km/h (80 mph).
- 05:00 UTC on August 26 – Weakens to a tropical storm while crossing Florida; emerges into the Gulf of Mexico north of Cape Sable.
- 06:00 UTC on August 26 – Regains hurricane strength over the Gulf of Mexico.
- 18:00 UTC on August 26 – Intensifies to Category 2 hurricane.
- 12:00 UTC on August 27 – Reaches Category 3 strength, with the eye located 690 km (430 miles) southeast of the Mississippi River delta.
- 06:00 UTC on August 28 – Strengthens to Category 4 hurricane.
- 12:00 UTC on August 28 – Rapidly intensifies to Category 5 hurricane.
- 18:00 UTC on August 28 – Peaks with sustained winds of 282 km/h (175 mph) and a minimum central pressure of 902 hPa, among the lowest recorded in the Atlantic Basin.
- 11:00 UTC on August 29 – Makes second landfall near Buras, Louisiana, as an upper-range Category 3 hurricane with sustained winds of 210 km/h (130 mph).
- 15:00 UTC on August 29 – Makes third landfall near the Louisiana–Mississippi border, just south of Pearlington, Mississippi, as a Category 3 hurricane with sustained winds of 195 km/h (120 mph).
- 00:00 UTC on August 30 – Weakens to a tropical storm northwest of Meridian, Mississippi.
- 12:00 UTC on August 30 – Further weakens to a tropical depression over Middle Tennessee.
- 00:00 UTC on August 31 – Transitions into an extratropical low over the Ohio Valley and is later absorbed by a frontal system over the Great Lakes.
Birth and life of Hurricane Katrina
Hurricane Katrina started as a tropical depression over the southeastern Bahamas. First detected on August 23, 2005, by August 24 it had already strengthened into a tropical storm as it moved into the central Bahamas.
The storm made its initial landfall as a Category 1 hurricane between Hallandale Beach and Aventura, Florida, on August 25, 2005 — not quite as historic as it would be four days later. The storm weakened as it moved over land but regained hurricane strength within an hour of entering the Gulf of Mexico.
It continued to strengthen, reaching Category 3 strength on August 27, and just nine hours later reached Category 5 strength on the morning of August 28. Within this period, Katrina’s minimum central pressure dropped to a jaw-dropping 902 hPa — the 7th lowest on record for Atlantic Basin hurricanes — while maximum sustained winds reached 282 km/h (175 mph).

This drop in minimum central pressure and subsequent strengthening was not well predicted at the time. Lower central pressure allows tropical cyclones to draw a stronger inflow of air, creating stronger winds and gusts. For context, one of the deadliest hurricanes of 2024, Hurricane Helene, had a minimum central pressure of 939 hPa with sustained winds reaching 225 km/h (140 mph).
At the time, Katrina was the strongest hurricane ever recorded in the Gulf of Mexico, only to be surpassed later that same season by Hurricane Rita.
The storm weakened slightly as it moved across the north-central Gulf, dropping to Category 4 and then to a strong Category 3 hurricane at the time of its second landfall at 06:10 LT (11:10 UTC) on August 29, near Buras-Triumph, Louisiana. Its estimated minimum central pressure at landfall was 920 hPa, the third-lowest on record for all hurricanes making U.S. landfall.
Katrina made its third and final landfall over Hancock County, Mississippi, as a Category 3 hurricane. It weakened into a tropical storm about 240 km (150 miles) inland near Meridian, Mississippi, and was downgraded to a tropical depression near Clarksville, Tennessee.
Its remnants were absorbed by a cold front in the eastern Great Lakes region on August 31, and the resulting extratropical storm moved rapidly northeast, affecting eastern Canada.
The costliest hurricane to ever hit the United States
Katrina is the 5th deadliest hurricane on record to strike the United States — the deadliest since Okeechobee (1928) — claiming at least 1 833 fatalities, according to the National Hurricane Center (NHC). It was also the costliest U.S. hurricane, causing damages worth around USD 108 billion, with some reports indicating up to USD 125 billion.
Katrina’s highest storm surge occurred from just east of the eye near Bay St. Louis, Mississippi, eastward to northern Mobile Bay. The Mobile State Docks measured the highest surge at 3.5 m (11.45 feet), while the lowest was 1.25 m (4.1 feet) in the Santa Rosa Sound in northwest Florida. Surge reached 3.5–4.3 m (12–14 feet) in Bayou La Batre, Alabama, and likely close to 6 m (20 feet) along the Mississippi–Alabama border.
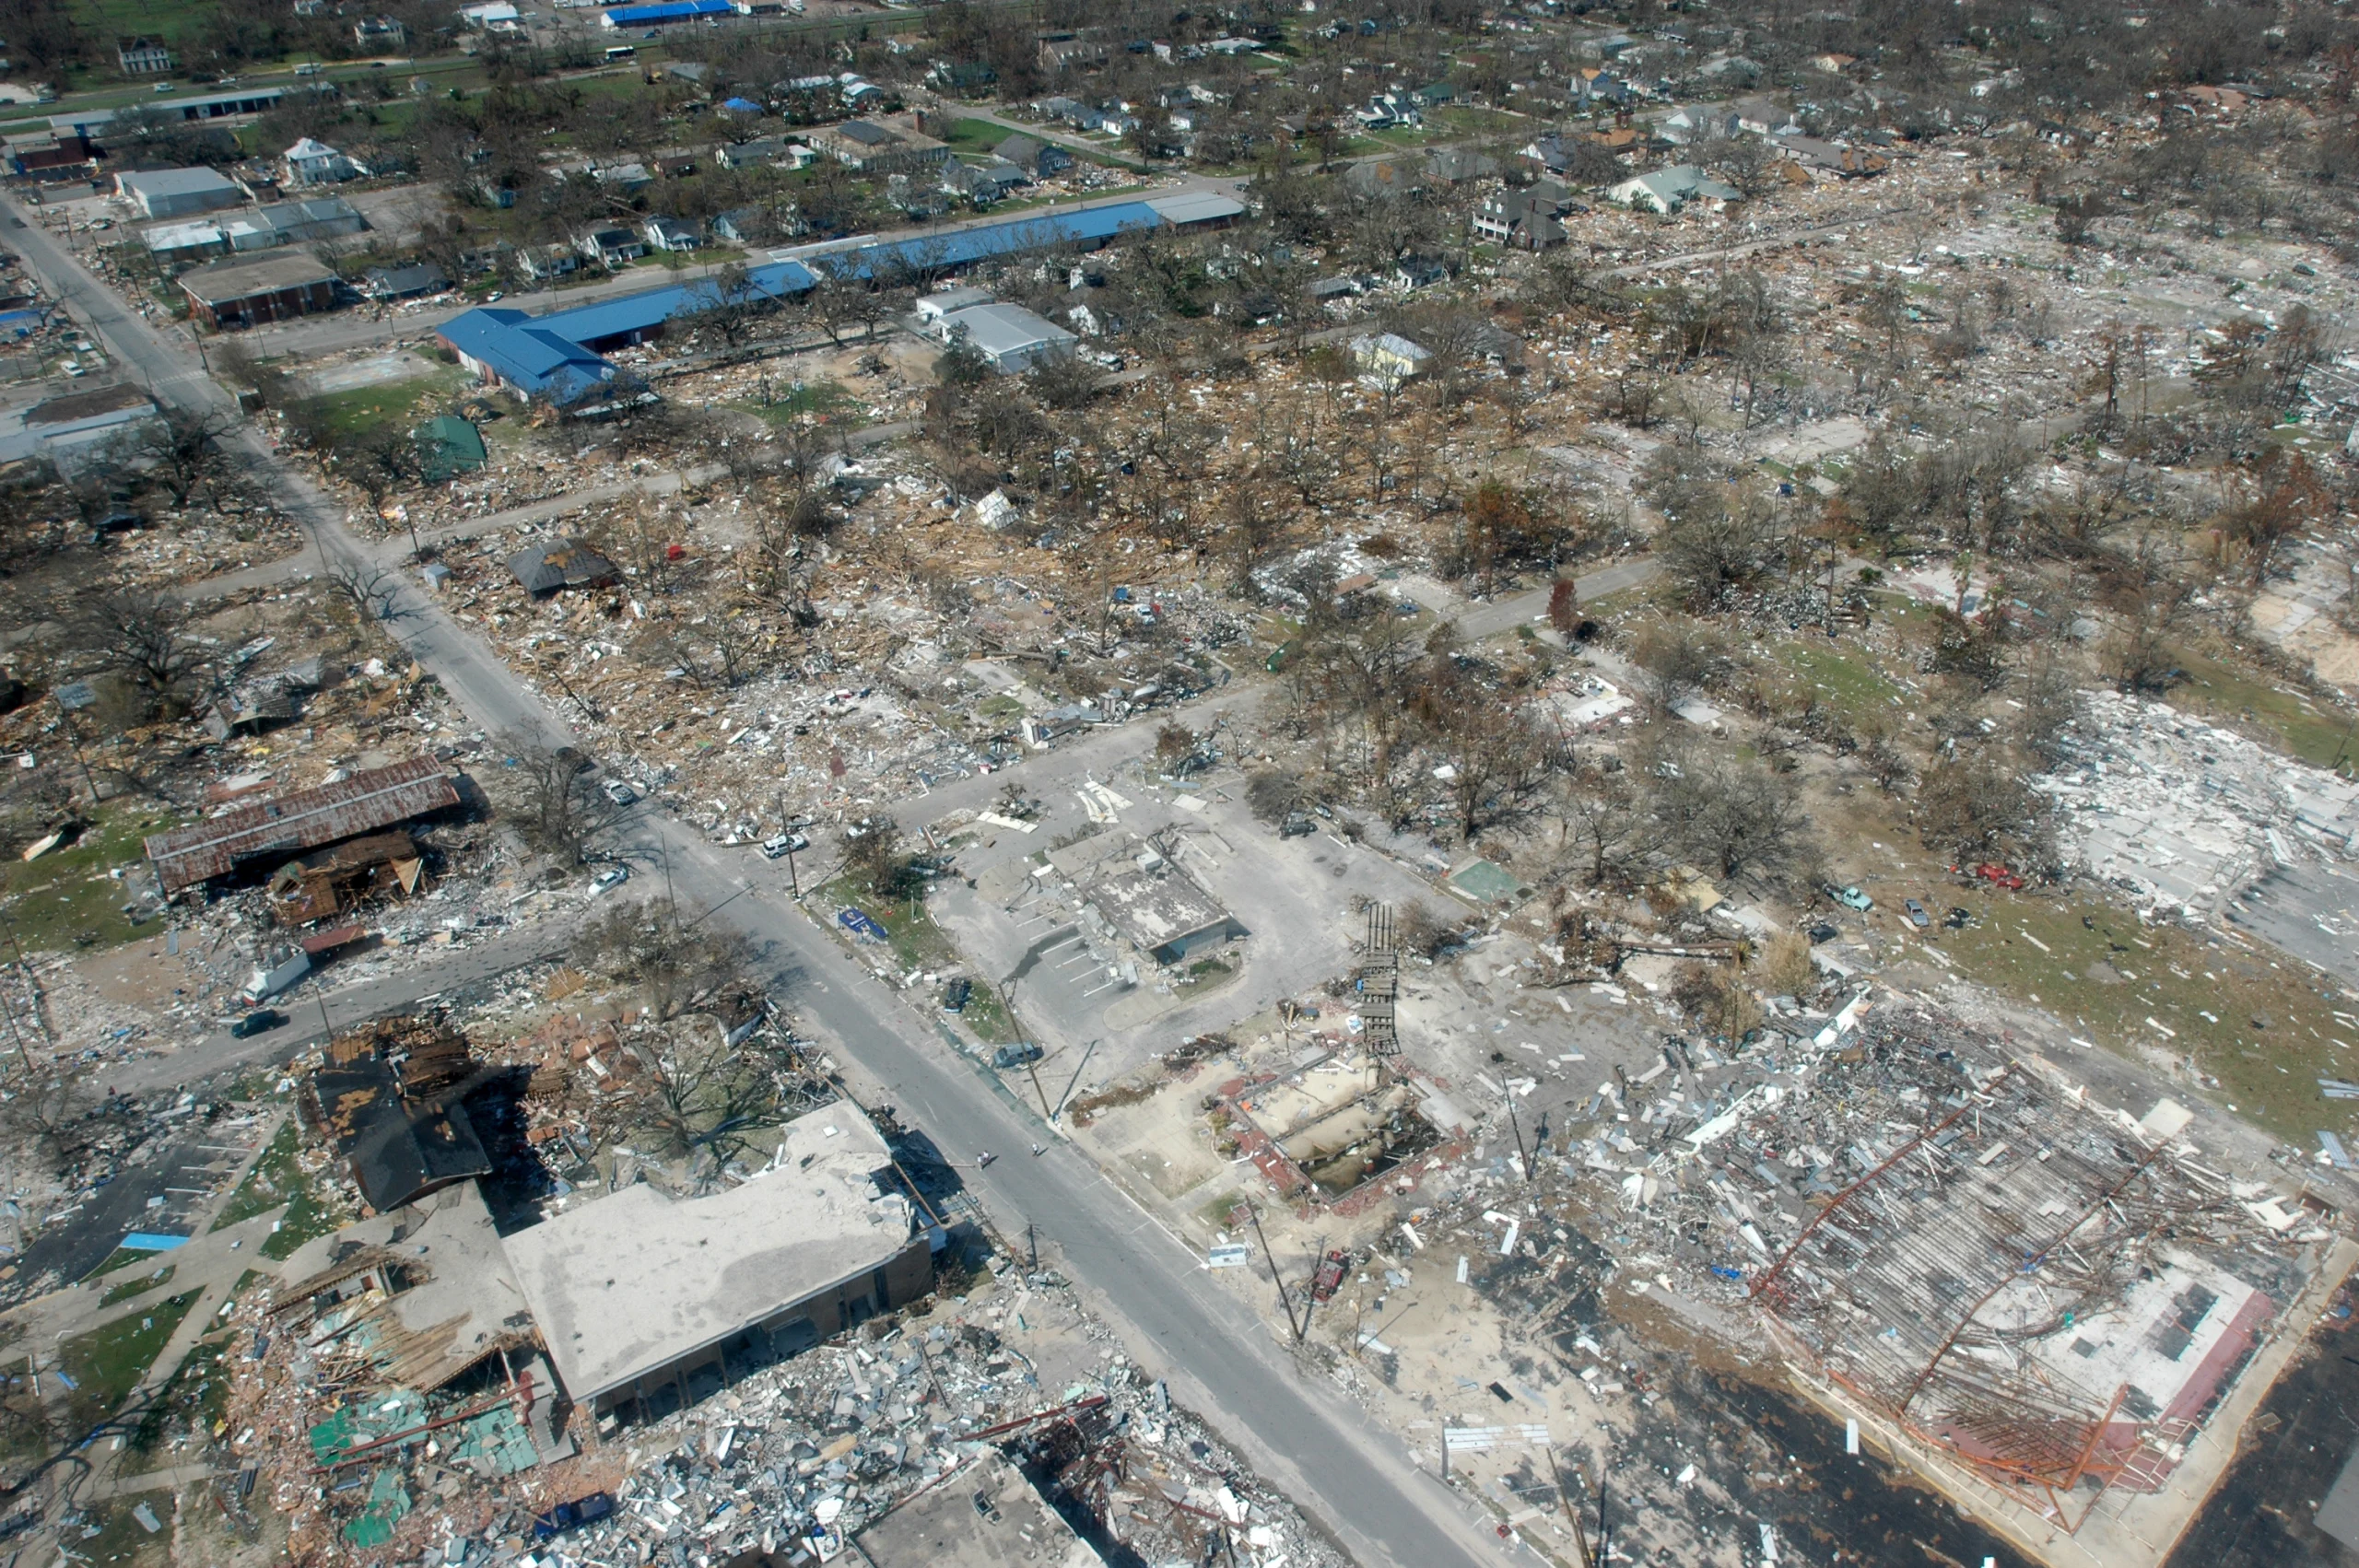
Louisiana was worst hit, reporting over 1 500 fatalities. New Orleans was the hardest-hit city, with up to 380 mm (15 inches) of rainfall recorded in parts of Louisiana. Katrina’s storm surge caused 53 breaches in the federally built levee system protecting metropolitan New Orleans and the failure of the 40 Arpent Canal levee.
Failures occurred in New Orleans and surrounding communities, especially St. Bernard Parish. The Mississippi River Gulf Outlet (MR-GO) breached in about 20 places, flooding much of eastern New Orleans, most of St. Bernard Parish, and the East Bank of Plaquemines Parish. Major breaches included the 17th Street Canal, the London Avenue Canal, and the Industrial Canal, leaving about 80% of the city flooded.
The outer bands of Hurricane Katrina produced numerous tornadoes throughout the southeastern United States on August 28–29, particularly in southern Alabama and the northwest Florida Panhandle. In total, four F0 tornadoes occurred in southern Alabama (two in Mobile County, one in Baldwin County, one in Escambia County) and five in northwest Florida (two in Okaloosa County, two in Santa Rosa County, one in Escambia County).
Most tornadoes were brief, with paths of 0.8–3.2 km (0.5–2 miles). The largest occurred near Munson, Florida, in Santa Rosa County, with a path length of 4.8 km (3 miles). Further inland, tornadoes rated F1–F2 occurred across Mississippi and Alabama with slightly longer paths. Most damage involved trees and power lines; no fatalities or injuries were reported.
What was hurricane forecasting like in 2005
One reason Katrina caused such devastation was the forecasting limitations of 2005. Rapid intensification — Katrina’s jump from Category 1 to Category 5 in under four days — was not predicted with the tools available then. This lack of advanced forecasting left authorities and residents under-prepared.
“Tropical weather outlooks back in 2005 were just blocks of plain text, no graphics, no percentages — just a couple of sentences saying something might develop in a day or two,” said Dr. Philippe Papin, senior hurricane specialist at the NHC.
In 2005, NHC forecasts had track errors of up to 96 km (60 miles), meaning a five-day forecast could be off by 480 km (300 miles). Intensity forecasts were also poor, often off by 20–25 mph (32–40 km/h).
What has changed in 20 years since Hurricane Katrina
Today, those errors have been cut in half. Hurricane watches and warnings can now be issued 36–48 hours in advance — 12 hours more than in 2005 — giving authorities and citizens valuable time to prepare. Intensity forecasts are now about twice as accurate as they were in 2005.
In 2025, the NHC can designate areas of potential storm development up to a week in advance, with percentages for forecast development. NOAA can also issue seasonal forecasts before the season begins.
Technological advances have been the biggest driver of improved forecast accuracy. A combination of satellites, aircraft observations, numerical forecasting models, and historical data is now used.
In 2005, satellite imagery was available every 30 minutes. Today, satellites typically capture imagery every 10 minutes, and during severe weather this can increase to every 30 seconds. Aircraft reconnaissance data were not integrated into modeling in 2005, but today unmanned drones are deployed for hurricane research.
Scientists also now have greater access to ocean data from gliders, floats, and drifters, providing insight into the turbulent boundary layer where air meets ocean. Computer models incorporate recent forecast errors and benefit from vastly improved computing power and understanding of hurricane physics.
All these advances have led to significant improvements in tropical cyclone forecasting over the past two decades.

I am an Assistant Editor and Severe Weather & Science Journalist at The Watchers, specializing in real-time severe weather coverage, geophysical event reporting, and research-driven scientific analysis. You can reach me at rishav(at)watchers(.)news.
Commenting rules and guidelines
We value the thoughts and opinions of our readers and welcome healthy discussions on our website. In order to maintain a respectful and positive community, we ask that all commenters follow these rules.