
Satellite estimates put African dust falling on the Amazon at about 28 million tonnes a year, while a model checked against measurements at Cayenne gives 8 to 10 million, and most of that settling happens from February to May.
An estimated 8 to 10 million tonnes of African dust settle over the Amazon basin each year, carrying phosphorus to nutrient-poor forest soils, according to atmospheric models checked against air measurements in South America. A 2015 satellite study put annual dustfall at about 28 million tonnes, although its uncertainty range included the lower estimates
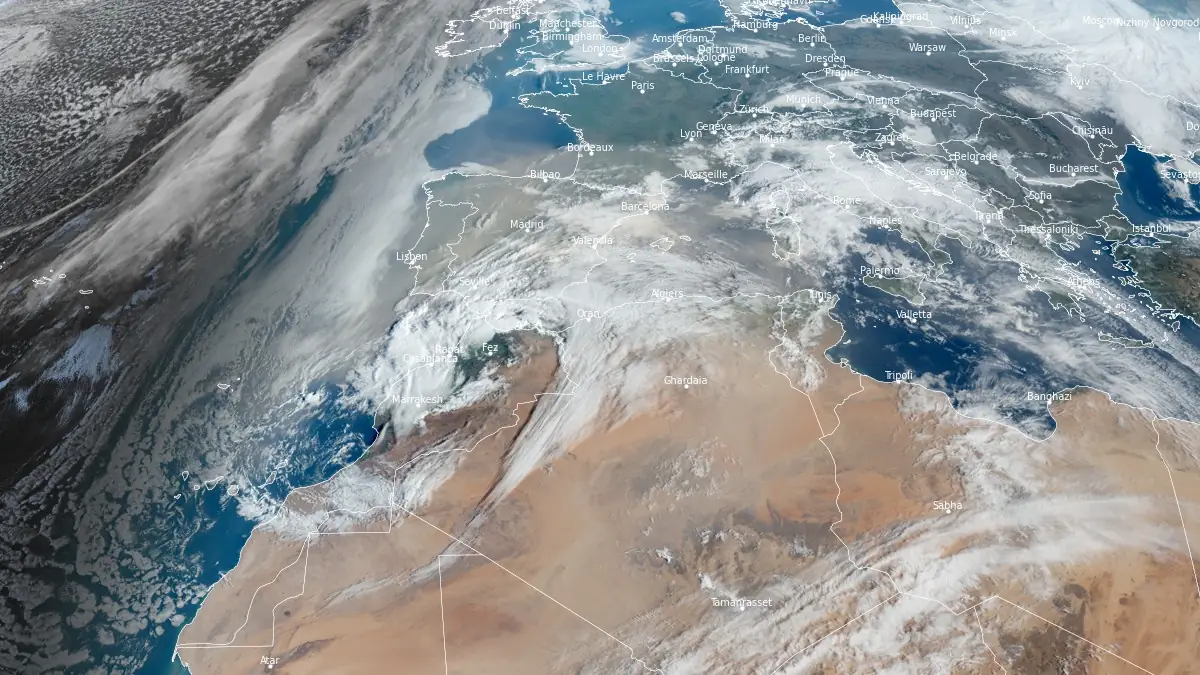
Satellite image showing Saharan dust over western Europe acquired at 08:10 UTC on March 4, 2026. Credit: EUMETSAT/Meteosat-10, The Watchers
On a wooded hill in Cayenne, French Guiana, air-quality technicians usually changed the filter on their sampler around noon. A day’s sample could hold sea salt from the nearby Atlantic and grains carried across it from North Africa. Researchers in Miami washed the salt from the used filters, then heated them to isolate the mineral dust.
Those grains carry phosphorus, a nutrient in short supply in many Amazonian soils. A 2015 satellite study estimated that about 28 million tonnes of African dust settled over the Amazon basin each year. Five years later, an atmospheric model checked against the Cayenne measurements put the total at 8 to 10 million tonnes, near the low end of the satellite study’s own range
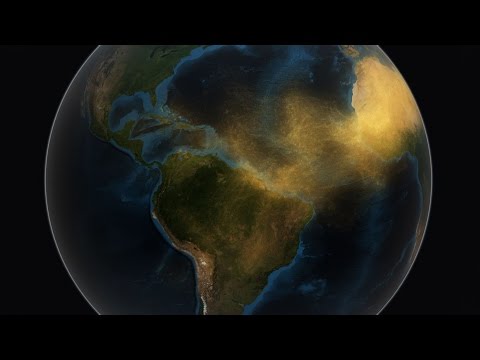
Two ways to weigh the dust
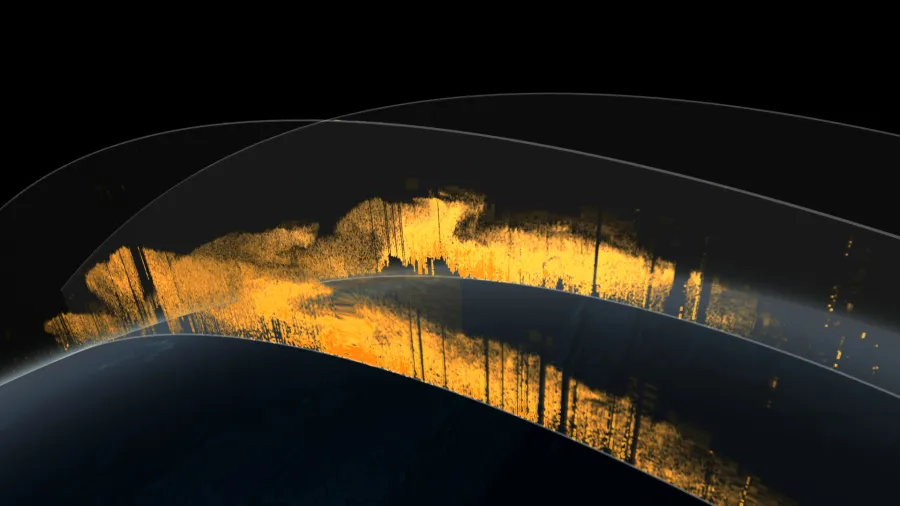
From 2007 to 2013, a laser aboard the CALIPSO satellite traced dust layers at different heights above the Atlantic. Hongbin Yu of NASA’s Goddard Space Flight Center and his colleagues combined those readings with wind data to estimate how much dust blew into the Amazon basin and how much blew out again. They counted the difference as dust that had settled.
The team estimated that winds carried about 182 million tonnes of dust a year past Africa’s west coast. The share that settled over the Amazon carried an estimated 22 000 tonnes of phosphorus. The record varied from year to year, and seven years of observations were too few to establish a long-term trend.
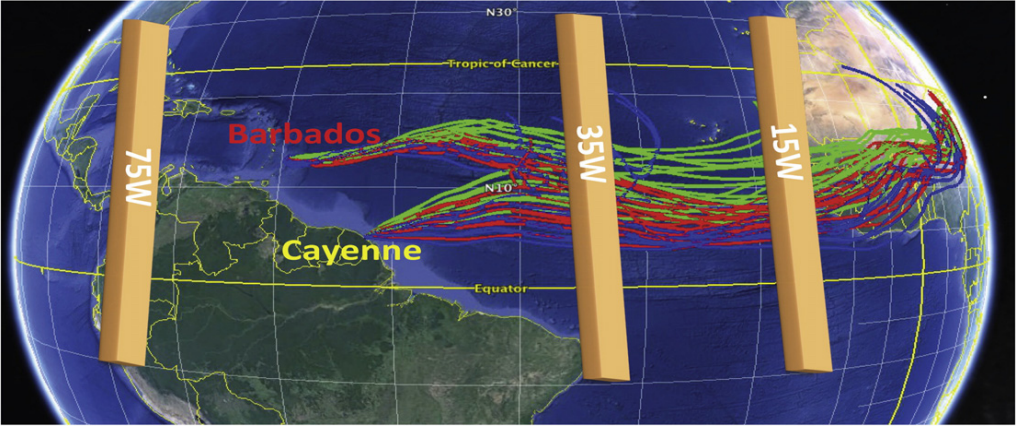
Joseph Prospero of the University of Miami and his colleagues started with the air people in Cayenne were breathing. The local air-quality agency, ATMO Guyane, had monitored airborne particles there from 2002 to 2017. The hilltop filters, first used in 2014, helped the researchers distinguish mineral dust from other particles in that longer record. NASA’s MERRA-2 atmospheric model closely matched the seasonal pattern they found.
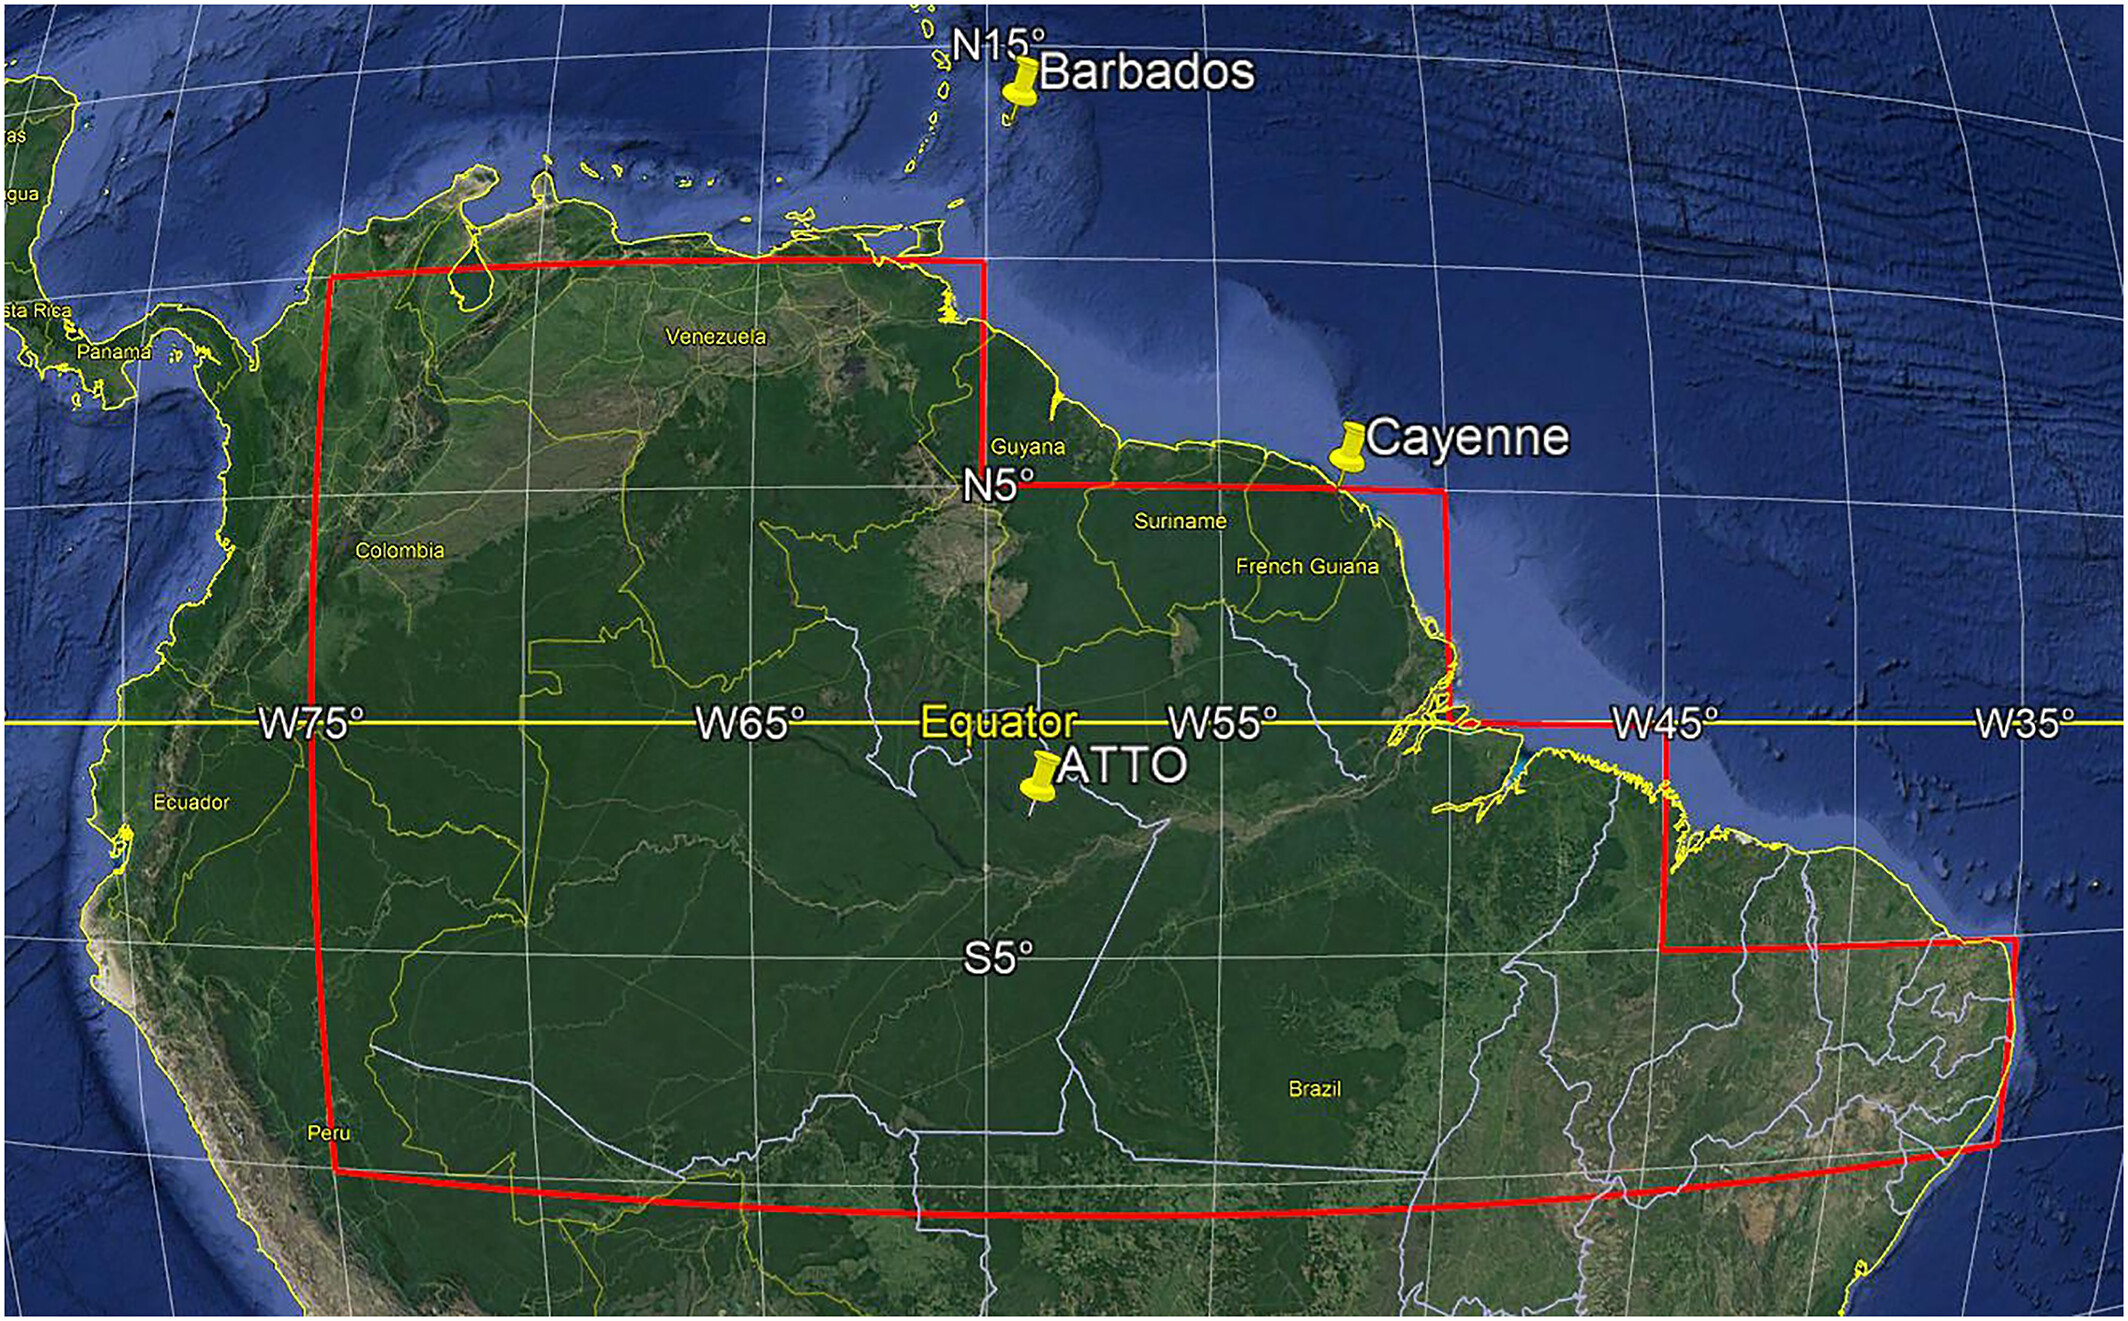
The team then used the model to estimate what fell across much of the Amazon basin. Including the southernmost strip of its study area gave 10.4 million tonnes a year. Leaving it out, because the researchers were less certain that the particles there were African dust, brought the total down to 8 million tonnes.
In 2021 study, Jasper Kok and colleagues identified another reason for the gap. Larger grains tend to settle out on the Atlantic crossing. The finer dust left aloft can block more light per tonne than the satellite calculation assumed, so the same signal can represent less dust.
Xurong Wang and colleagues took their comparison inland. In a 2023 study, they checked their model against air measurements at Cayenne and at the Amazon Tall Tower Observatory in Brazil. For 2013 to 2017, they estimated that about 10 million tonnes of African dust settled across the basin each year, carrying roughly 8 500 tonnes of phosphorus.
How the dust estimates compare
| Study and period covered | Annual estimate (million tonnes) | What the figure represents |
| Yu et al. (2015) 2007–2013 | 27.7 | Satellite estimate. The authors reported an uncertainty range of 8 to 48 million tonnes. |
| Prospero et al. (2020) 2002–2017 | 8 to 10 | Model checked against air measurements at Cayenne. The total depends on whether the southernmost part of the study area is included. |
| Kok et al. (2021) 2004–2008 | 8.5 | Estimated deposition over the rainforest from all dust sources combined. |
| Wang et al. (2023) 2013–2017 | 10 ± 1.7 | Modeled African dust deposition. Observations from Cayenne and inland Brazil helped the researchers check the model. |
Note: The studies cover different years and areas, so the figures cannot establish whether dustfall has declined over time.
Where the rain brings it down
In Prospero’s model, 89% of the dust that settled around Cayenne came down between February and May. During that season, rain washed most of it out of the air. In the Northern Hemisphere summer, the tropical rain belt shifts north and more plumes head toward the Caribbean and the southern United States. The model placed the heaviest deposits in northern and northeastern South America, with much less dust reaching the central Amazon.
A 2020 study comparing two desert regions found that dust from El Djouf in Mauritania and Mali had a more favorable route to the Amazon than dust from Chad’s Bodélé Depression. The source can vary even between winters. Chemical fingerprints in grains collected at Cayenne traced the largest share to western North Africa in the winter of 2014 and to central North Africa in the winter of 2016.
What reaches the trees
When a leaf decays on the forest floor, its phosphorus returns to the soil, where roots can take it up again. Rain carries some into streams and rivers. Yu’s team estimated that African dust delivered roughly as much phosphorus as the basin loses this way. Smoke from southern African fires also brought phosphorus to Cayenne, some of it in a form that dissolves readily in water.
In an old-growth forest north of Manaus, Brazil, researchers added phosphorus to experimental plots. After two years, fine-root production was 29% higher in the plots that received phosphorus. The experiment showed what extra phosphorus could do for trees on those soils. To learn how much the Sahara supplies that far inland, Prospero and his colleagues called for measurements of airborne particles and rain in the forest itself.
References:
1 Yu, H., et al. (2015). The fertilizing role of African dust in the Amazon rainforest: A first multiyear assessment based on data from Cloud-Aerosol Lidar and Infrared Pathfinder Satellite Observations. Geophysical Research Letters
2 Prospero, J. M., et al. (2020). Characterizing and Quantifying African Dust Transport and Deposition to South America: Implications for the Phosphorus Budget in the Amazon Basin. Global Biogeochemical Cycles
3 Yu, H., et al. (2015). Quantification of trans-Atlantic dust transport from seven-year (2007–2013) record of CALIPSO lidar measurements. Remote Sensing of Environment
4 Kok, J. F., et al. (2021). Contribution of the world’s main dust source regions to the global cycle of desert dust. Atmospheric Chemistry and Physics.
5 Yu, Y., et al. (2020). Disproving the Bodélé Depression as the Primary Source of Dust Fertilizing the Amazon Rainforest. Geophysical Research Letters
6 Barkley, A. E., et al. (2022). Interannual Variability in the Source Location of North African Dust Transported to the Amazon. Geophysical Research Letters
7 Barkley, A. E., et al. (2019). African biomass burning is a substantial source of phosphorus deposition to the Amazon, Tropical Atlantic Ocean, and Southern Ocean. Proceedings of the National Academy of Sciences
8 Cunha, H. F. V., et al. (2022) University of Edinburgh
9 Wang, X., et al. (2023). The export of African mineral dust across the Atlantic and its impact over the Amazon Basin. Atmospheric Chemistry and Physics
10 NASA Satellite Reveals How Much Saharan Dust Feeds Amazon’s Plants – NASA – February 15, 2025

Rishav Kothari is Editor-in-Chief of The Watchers, where he runs the newsroom and covers earthquakes, volcanoes, severe weather and space weather.
