
Average number of tornadoes during extreme weather outbreaks rising since 1954
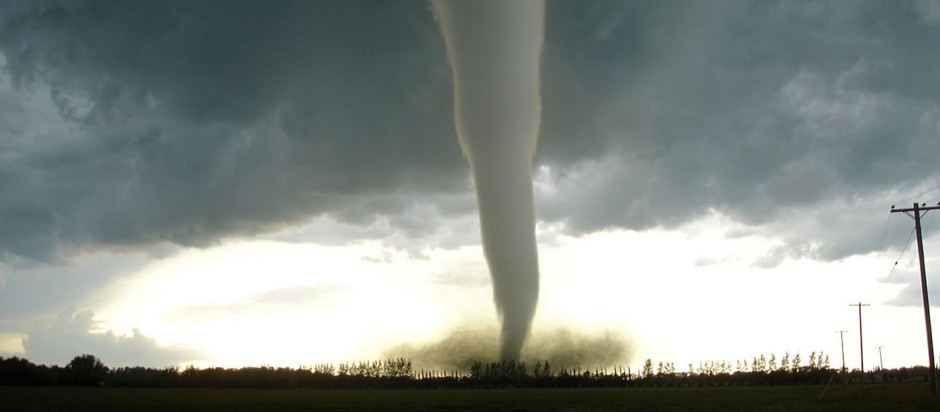
Featured image: Category F5 tornado (upgraded from the initial estimate of F4) viewed from the southeast as it approached Elie, Manitoba on Friday, June 22nd, 2007. Credit: Justin1569
New research shows the average number of tornadoes occurring during severe weather outbreaks is rising since 1954. The cause for this upward trend is still unknown.
Tornadoes occur during the outbreak of extreme weather conditions caused by the large-scale weather systems which can last between one to three days and cross large distances. The biggest ever recorded outbreak happened in 2011 when 363 tornadoes were reported across the US and Canada. Over 350 people died on the occasion and damage caused was $11 billion.
Numerous tornadoes sweep the North America every year. Some of the outbreaks are small while others, the so-called "super-outbreaks," like the ones which occurred in 1974 and 2011, are capable of producing hundreds of twisters. Lower tornado levels cause little to no damage while others can topple trees, rise cars, rip roofs or even entire homes from their foundations.
As a part of the new study, the researchers have calculated the mean number of tornadoes per extreme weather outbreak, and the variance around its mean. While the average number per outbreak has risen, the total number of tornadoes rated F/EF1 and higher each year hasn't increased.
The study also suggests the chances of such extreme weather outbreaks have risen.
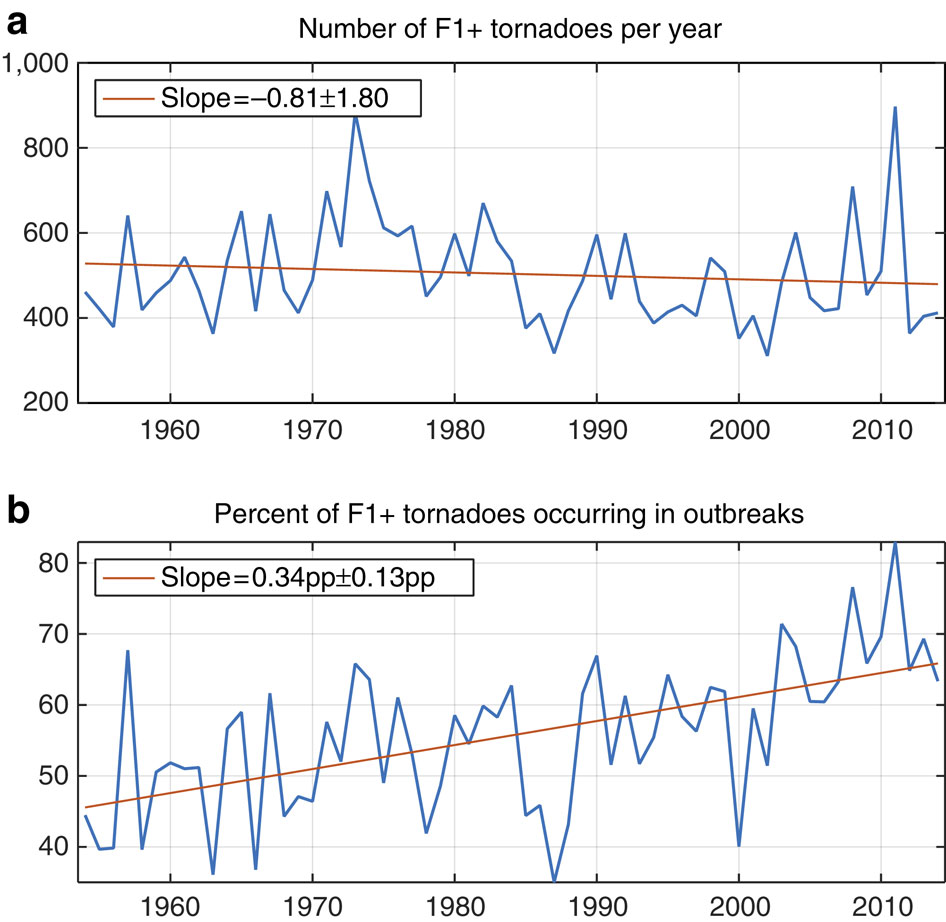
Time series of counts and clustering of F1+ tornadoes 1954–2014 in the contiguous US. (a) Number of F1+ tornadoes per year. The slope of the least-squares regression indicates that the number of F1+ tornadoes per year declined by 0.81 per year on average from 1954 to 2014 inclusive. This rate of decline is not statistically significantly different from 0 (no change). (b) Annual percentage of F1+ tornadoes occurring in outbreaks. The slope of the least-squares regression indicates that the percentage of F1+ tornadoes per year that occurred as part of outbreaks increased by 0.34 percentage points (pp) per year on average from 1954 to 2014 inclusive. This increase is statistically significantly greater than 0. In both aand b, ± intervals are 95% confidence intervals. Credit: Michael K. Tippett & Joel E. Cohen / Nature Communications
"The science is still open. It could be global warming, but our usual tools, the observational record and computer models, are not up to the task of answering this question yet," said Michael Tippett, a climate and weather researcher at Columbia University's School of Applied Science and Engineering and Columbia's Data Science Institute, a lead author of the study.
"When it comes to tornadoes, almost everything terrible that happens, happens in outbreaks. If outbreaks contain more tornadoes on average, then the likelihood they'll cause damage somewhere increases."
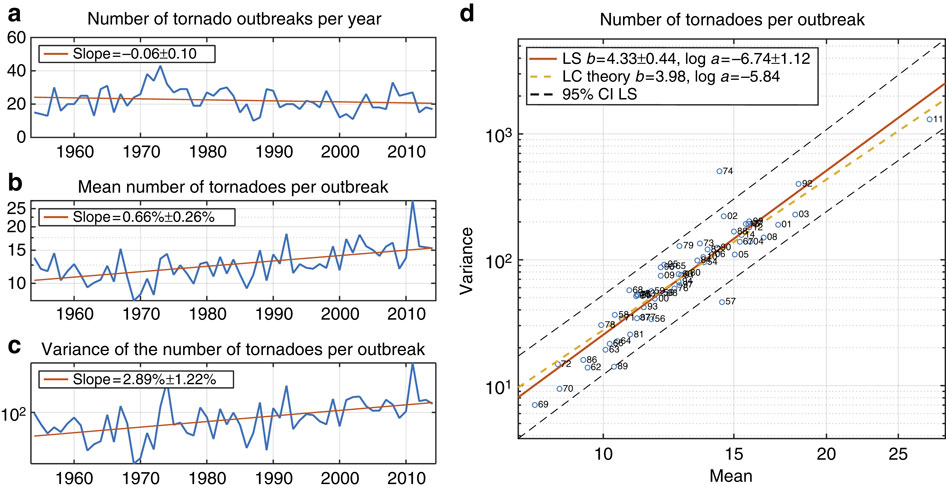
Numbers of F1+ tornadoes per outbreak 1954–2014. (a) Number of tornado outbreaks per year. The rate of decline is not statistically significantly different from 0 (no change). (b) Annual mean number of tornadoes per outbreak. Vertical axis is on logarithmic scale, so the rate of increase in the annual mean is expressed as a percentage per year. This rate of increase is statistically significantly greater than 0. (c) Annual variance of the number of tornadoes per outbreak. Vertical axis is on logarithmic scale, so the rate of increase in the annual mean is expressed as a percentage per year. This rate of increase is statistically significantly greater than 0. (d) Scatter plot of the annual mean number of tornadoes per outbreak versus the annual variance of the number of tornadoes per outbreak. Both axes are on logarithmic scale. The solid red line is the least-squares (LS) regression line (Taylor’s power law of fluctuation scaling) and the dashed yellow line has the slope and intercept predicted by LC theory 17. The two-digit number following the plotting symbol 'o' gives the calendar year in the second half of the twentieth century or first half of the twenty-first century. In all the panels, ± intervals are 95% confidence intervals. Credit: Michael K. Tippett & Joel E. Cohen / Nature Communications
"The analysis showed that as the mean number of tornadoes per outbreak rose, the variance around that mean rose four times faster. While the mean rose by a factor of 1.5 over the last 60 years, the variance rose by a factor of more than 5, or 1.5 x 1.5 x 1.5 x 1.5. This kind of relationship between variance and mean has a name in statistics: Taylor's power law of scaling," said Joel Cohen, director of the Laboratory of Populations, based at Rockefeller University and Columbia's Earth Institute, and the co-author of the study,
"We have seen [Taylor's power law] in the distribution of stars in a galaxy, in death rates in countries, the population density of Norway, securities trading, oak trees in New York and many other cases. But this is the first time anyone has shown that it applies to scaling in tornado statistics."
Cohen explained the exponent in Taylor's law number can be a measure of clustering. If there's no clustering, if tornadoes occur just randomly, then Taylor's law has an exponent of 1. If there's clustering, then it's greater than 1. "In most ecological applications, the Taylor exponent seldom exceeds 2. To have an exponent of 4 is truly exceptional. It means that when it rains, it really, really, really pours," explained Cohen.
"The scientific community has thought a great deal about how the frequency of future weather and climate extremes may change in a warming climate. The simplest change to understand is a shift of the entire distribution, but increases in variability, or variance, are possible as well. With tornadoes, we're seeing both of those mechanisms at play," Tippet explained.
"This paper helps begin to answer one of the fundamental questions to which I'd like to know the answer. If tornadoes are being concentrated into more big days, what effect does that have on their impacts compared to when they were less concentrated?" said Harold Brooks of the US National Oceanic and Atmospheric Administration's National Severe Storms Laboratory.
"One big question raised by this work, and one we're working on now, is what in the climate system has been behind this increase in outbreak severity," concluded Tippett.
From the abstract:
Here we find an upward trend in the annual mean number of tornadoes per US tornado outbreak for the period 1954–2014. Moreover, the variance of this quantity is increasing more than four times as fast as the mean. The mean and variance of the number of tornadoes per outbreak vary according to Taylor’s power law of fluctuation scaling (TL), with parameters that are consistent with multiplicative growth. Tornado-related atmospheric proxies show similar power-law scaling and multiplicative growth. Path-length-integrated tornado outbreak intensity also follows TL, but with parameters consistent with sampling variability. The observed TL power-law scaling of outbreak severity means that extreme outbreaks are more frequent than would be expected if mean and variance were independent or linearly related.
References:
- "Tornado outbreak variability follows Taylor’s power law of fluctuation scaling and increases dramatically with severity" – Michael K. Tippett & Joel E. Cohen – Nature Communications (2016) – doi:10.1038/ncomms10668 – OPEN ACCESS
"Extreme Tornado Outbreaks Have Become More Common, Says Study" – The Earth Institute – Columbia University (accessed March 3, 2016)
I know the reason.
It’s Planet X approaching.