
The effects of solar variability on Earth’s climate
Image credit: SDO
A new report issued by the National Research Council (NRC), “The Effects of Solar Variability on Earth’s Climate,” lays out some of the surprisingly complex ways that solar activity can make itself felt on our planet.
The luminosity of our own sun varies a 0.1% over the course of the 11-year solar cycle. Even these negligible variations can have a significant effect on terrestrial climate. According to Greg Kopp of the Laboratory for Atmospheric and Space Physics at the University of Colorado, pointed out that while the variations in luminosity over the 11-year solar cycle amount to only a tenth of a percent (0.1%) of the sun’s total output, such a small fraction is still important. Even typical short-term variations of 0.1% in incident irradiance exceed all other energy sources (such as natural radioactivity in Earth’s core) combined.
The sun’s extreme ultraviolet (EUV) radiation peaks during the years around solar maximum. This can strongly affect the chemistry and thermal structure of the upper atmosphere.
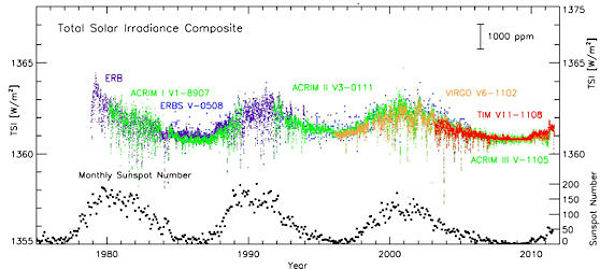 Space-borne measurements of the total solar irradiance (TSI) show ~0.1 percent variations with solar activity on 11-year and shorter timescales. These data have been corrected for calibration offsets between the various instruments used to measure TSI. (Courtesy of Greg Kopp, University of Colorado.)
NRC had to assemble dozens of multi-disciplinary experts from fields of plasma physics, solar activity, atmospheric chemistry and fluid dynamics, energetic particle physics, and even terrestrial history at a single workshop.
Several researchers discussed how changes in the upper atmosphere can trickle down to Earth’s surface. There are many “top-down” pathways for the sun’s influence. According to Charles Jackman of the Goddard Space Flight Center, nitrogen oxides (NOx) created by solar energetic particles and cosmic rays in the stratosphere can reduce ozone levels by a few percent. Ozone absorbs UV radiation, so less ozone means that more UV rays from the sun could reach the lower atmosphere and Earth’s surface.
Isaac Held of NOAA described how loss of ozone in the stratosphere could alter the dynamics of the atmosphere below it. The cooling of the polar stratosphere associated with loss of ozone increases the horizontal temperature gradient near the tropopause. This alters the flux of angular momentum by mid-latitude eddies. Solar activity felt in the upper atmosphere can, through a complicated series of influences, push surface storm tracks off course.
The NRC report suggests that the influence of solar variability is more regional than global. The Pacific region is one of the best examples. Gerald Meehl of the National Center for Atmospheric Research (NCAR) presented persuasive evidence that solar variability is leaving an imprint on climate, especially in the Pacific. According to the report, when researchers look at sea surface temperature data during sunspot peak years, the tropical Pacific shows a pronounced La Nina-like pattern, with a cooling of almost 1o C in the equatorial eastern Pacific. The equatorial central Pacific is generally cooler, the runoff from rivers in Peru is reduced, and drier conditions affect the western USA.
 Composite averages for December-January-February for peak solar years (Credit: G.A. Meehl, J.M. Arblaster, K. Matthes, F. Sassi, and H. van Loon/AAAS)
Scientists also discovered signs of enhanced precipitation in the Pacific Inter-Tropical Convergence Zone (ITCZ ) and South Pacific Convergence Zone (SPCZ) as well as above-normal sea-level pressure in the mid-latitude North and South Pacific, correlated with peaks in the sunspot cycle. According to Raymond Bradley of UMass, the regional rainfall seems to be more affected than temperature. IPCC and previous NRC reports concluded that solar variability is not the cause of global warming over the last 50 years.
Scientists wonder if something in the Pacific climate system is acting to amplify solar cycle signals. Researchers question how the relatively small fluctuations of the 11-year solar cycle can produce the magnitude of the observed climate signals in the tropical Pacific. Supercomputer models of climate showed that not only “top-down” but also “bottom-up” mechanisms involving atmosphere-ocean interactions are required to amplify solar forcing at the surface of the Pacific.
Ongoing Solar Cycle 24 is the weakest in more than 50 years. There are some controversial evidences of a long-term weakening trend in the magnetic field strength of sunspots. Matt Penn and William Livingston of the National Solar Observatory predict that by the time Solar Cycle 25 arrives, magnetic fields on the sun will be so weak that few if any sunspots will be formed. Independent lines of research involving helioseismology and surface polar fields tend to support their conclusion.
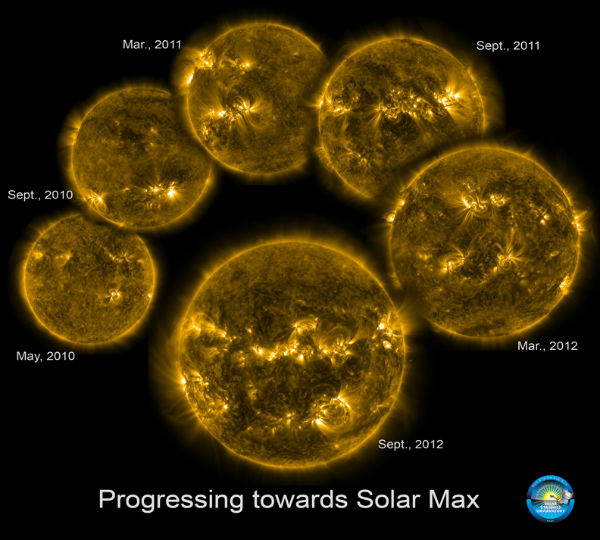 These six images from SDO, chosen to show a representative image about every six months, track the rising level of solar activity since the mission first began to produce consistent images in May, 2010. The period of solar maximum is expected in 2013. The images were taken in the 171 Angstrom wavelength of extreme ultraviolet light. (Credit: SDO)
The solar disk is dotted by the dark cores of sunspots and splashed with bright magnetic froth known as faculae. Planned radiometric imaging will map the surface of the sun and reveal the contributions of each to the sun’s luminosity, especially the faculae. A radiometric imager, deployed on some future space observatory, would allow researchers to develop the understanding they need to project the sun-climate link into a future of prolonged spotlessness.
Variations in Earth’s magnetic field and atmospheric circulation can affect the deposition of radioisotopes far more than actual solar activity. A better long-term record of the sun’s irradiance might be encoded in the rocks and sediments of the Moon or Mars.
The full report, “The Effects of Solar Variability on Earth’s Climate,” is available from the National Academies Press at here.
Sources: NASA, National Research Council
Commenting rules and guidelines
We value the thoughts and opinions of our readers and welcome healthy discussions on our website. In order to maintain a respectful and positive community, we ask that all commenters follow these rules.