
Decade-long California test shows which next-day earthquake forecasts hold up
A decade-long prospective experiment in California found that selected short-term earthquake forecasting models remained statistically consistent with the number, locations and magnitudes of earthquakes recorded after their forecasts were issued. The test subjected 27 models to future observations rather than earthquakes already known during model development, providing an unusually long real-world assessment of whether operational-type forecasts retain statistical reliability outside retrospective testing.
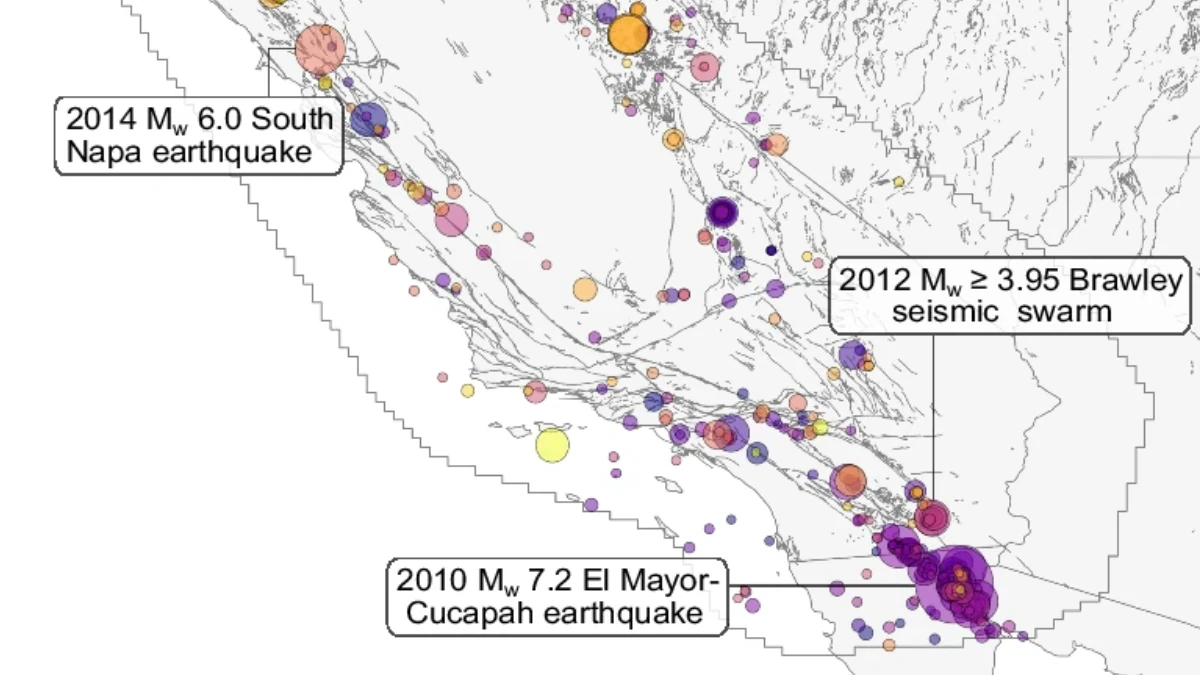
Image credit: Bayona, J.A., Serafini, F., Silva, F. et al. Select earthquake forecasting models demonstrate consistency with prospective decadal observations in California
Bayona et al. (2026) evaluated 51 625 next-day forecasts generated prospectively by the Collaboratory for the Study of Earthquake Predictability (CSEP) between August 2007 and August 2018.
The forecasts were tested against 597 earthquakes with Mw ≥3.95 in the California test region. Each forecast was issued at 00:00 UTC for the following 24 hours and could use only earthquake information available before that forecast period began.
That prospective design addresses one of the central uncertainties in earthquake forecasting research. A model can reproduce past seismicity after its developers have already seen the earthquake record, but that does not establish how it will perform against events that have not yet occurred.
CSEP fixes the forecast rules and evaluation framework in advance, then compares the resulting probability distributions with future observations. The new analysis therefore tests whether models that resemble those used in operational earthquake forecasting can maintain statistical consistency over years of genuinely unseen seismicity.
A CSEP daily forecast is not a prediction that a particular earthquake will strike a specific place at a specific time. The models assign expected earthquake rates across a predefined spatial and magnitude grid for the next 24 hours. Statistical tests then ask whether the earthquakes that actually occur are compatible with the forecast distribution in terms of their total number, locations, and magnitudes.
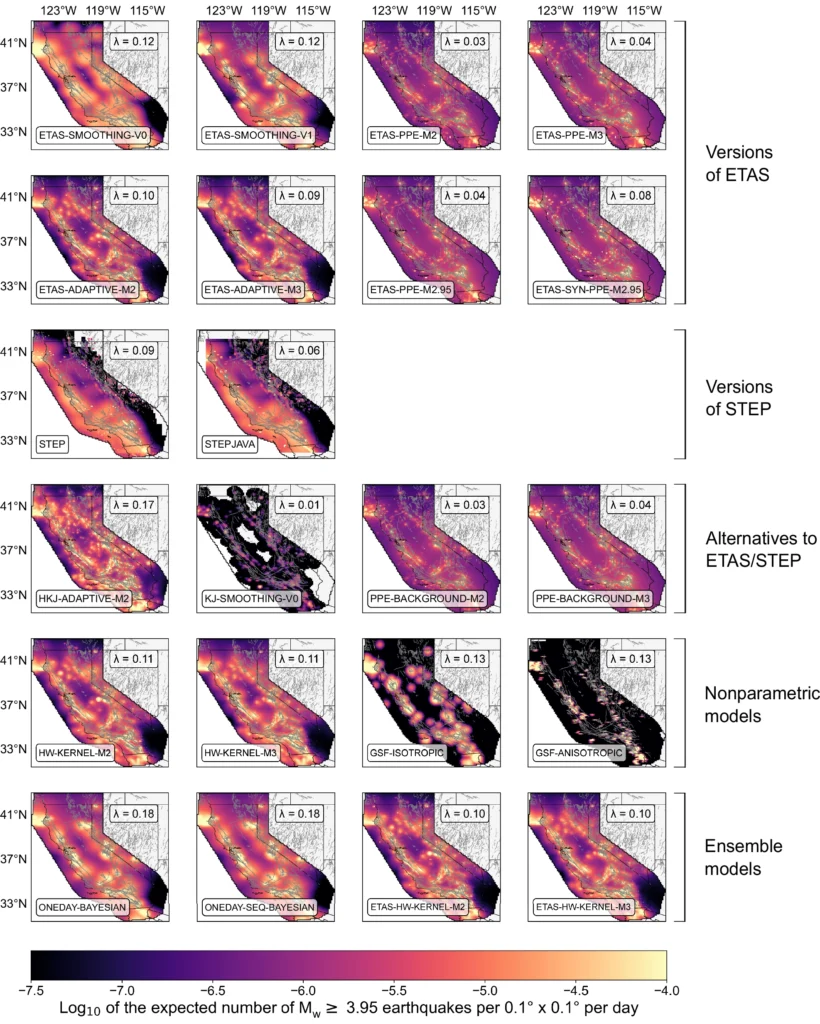
Serafini et al. (2025), who documented the underlying forecast archive, described this grid-based structure as expected earthquake rates across space and magnitude rather than deterministic event locations.
Across the prospective record, approximately 95% of the evaluated models produced forecasts consistent with the cumulative number of observed earthquakes under the study’s Negative Binomial Distribution count assessment. More than two-thirds were statistically consistent with the observed epicentral locations, while approximately 95% produced magnitude distributions consistent with the recorded earthquakes.
At the individual-model level, selected versions of established ETAS and STEP-type forecasting approaches maintained statistical agreement with the prospective observations.
Among the 21 time-varying Mw ≥3.95 models evaluated with the Negative Binomial Distribution test, 20 statistically captured the cumulative number of earthquakes, but the standard CSEP Poisson number test was considerably stricter: only ETAS-PPE-M2.95 and STEPJAVA were statistically consistent under that assessment.
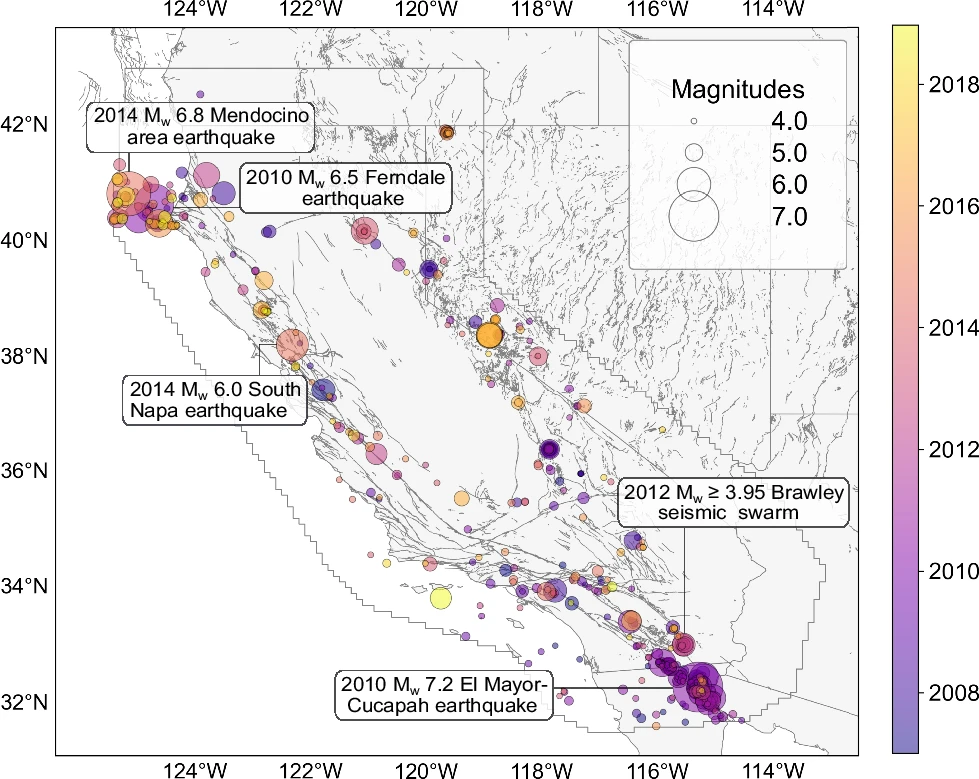
The models also showed a clear limitation on the days when several larger California sequences began. All of the forecasts underestimated the number of Mw ≥3.95 earthquakes observed on the days of the 2010 Mw6.5 Ferndale earthquake, the 2010 Mw7.2 El Mayor–Cucapah earthquake, the 2012 Brawley swarm and the 2014 Mw6.8 Mendocino earthquake.
The paper attributed these failures to the low probability assigned to a large earthquake before it occurs, together with the fact that the aftershocks it is about to trigger cannot yet be represented as an elevated sequence unless seismicity is already high.
Forecast performance improved after several sequences had begun. During the two weeks following the Ferndale earthquake, the Brawley swarm and the two Northern California sequences examined from 2014, more than 80% of the models were statistically consistent with the observed daily earthquake counts.
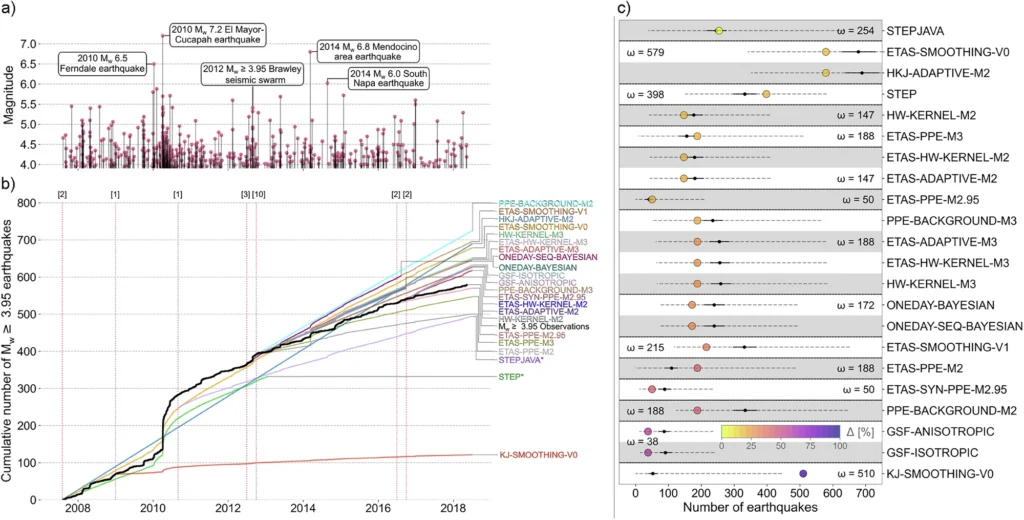
Following El Mayor–Cucapah, underestimation persisted during the first two days of the sequence before ETAS-SMOOTHING-V0 and STEP captured the observed daily count.
The change illustrates what triggering models are designed to exploit. Once an earthquake occurs, the recent seismic record contains new information about where and when additional earthquakes are more probable. Forecast rates can then rise around an active sequence.
What the models do not provide is advance knowledge of the exact time, location, and magnitude of the initiating earthquake. University of Bristol researcher José A. Bayona made the same distinction in the university’s October release, separating probabilistic forecasts from exact earthquake prediction.
Magnitude forecasting produced some of the strongest statistical agreement. The standard CSEP magnitude test found all evaluated models consistent with the observed frequency-magnitude distribution.
A separate non-parametric Kolmogorov–Smirnov assessment found all time-varying models except STEPJAVA statistically consistent with the observed magnitudes. Spatial performance was less uniform, with slightly more than two-thirds of models passing the corresponding consistency assessment.
The study does not establish that every model was equally skillful, nor does statistical consistency mean that a model correctly identified individual earthquakes.
Consistency tests ask whether observations are compatible with a forecast’s statistical distribution; they are not rankings of which model is best. The companion CSEP database documentation makes the same distinction, noting that consistency tests assess whether forecasts and observations are statistically compatible, while separate comparative scores are needed to evaluate one model against another.
The California archive is unusually valuable because its forecasts were generated under controlled prospective conditions rather than reconstructed afterward. Serafini et al. (2025) documented 25 fully automated models and more than 50 000 daily forecasts in the benchmark database, with model inputs restricted to information available before each forecast. The 2026 evaluation uses a broader set of 27 forecasting models and 597 target earthquakes to assess performance over the decadal experiment.
The benchmark also exposes limits that future forecasting systems must confront. The statistical models represent expected earthquake distributions within space-magnitude cells and do not fully describe all sources of forecast uncertainty, according to the authors.
Their performance is additionally constrained by the California test region, the Mw ≥3.95 target threshold, and the particular statistical tests used in the experiment. The results therefore provide evidence for the long-term statistical behavior of a defined class of probabilistic forecasting models, not a general demonstration that earthquakes can be predicted.
CSEP has made the benchmark forecasts and associated tools available for researchers to test new models against the same prospective record. The companion dataset provides standardized forecast files, evaluation code, and pyCSEP tools, while the 2026 study supplies a reproducibility package for its analyses. That allows later models to be compared with forecasts that were fixed before the California earthquakes occurred, preserving the feature that gives the experiment its principal scientific value.
References:
1 Bayona, J. A., Serafini, F., Silva, F., Iturrieta, P. C., Savran, W. H., Herrmann, M., Marzocchi, W., Maechling, P. J., & Werner, M. J. (2026). Select earthquake forecasting models demonstrate consistency with prospective decadal observations in California. Nature Communications, 17, 9444. https://doi.org/10.1038/s41467-026-76243-7
2 Serafini, F., Bayona, J. A., Silva, F., Savran, W. H., Stockman, S., Maechling, P. J., & Werner, M. J. (2025). A benchmark database of ten years of prospective next-day earthquake forecasts in California from the Collaboratory for the Study of Earthquake Predictability. Scientific Data, 12, 1501. https://doi.org/10.1038/s41597-025-05766-3
3 New forecasting research could help millions living in earthquake-prone regions – University of Bristol – October 15, 2026

I’m a science journalist and researcher at The Watchers, contributing to the Epicenter edition, where I cover peer-reviewed scientific research and emerging discoveries across Earth and space sciences. With a background in astronomy and a passion for environmental science, I’ve worked in shark and coral conservation in Fiji, conducting reef and shark-behavior research, contributing to mangrove restoration, and earning PADI Open Water and Coral Reef Certifications. I bring a blend of scientific rigor and storytelling to illuminate the discoveries shaping our planet and beyond.
Published in the last 24 hours
- In 1943, a flight instructor in Texas flew a two-seat training plane into the eye of a hurricane because he was curious, then landed and took the base weatherman up for a second pass Epicenter
- In 2013 a landslide fell onto Svínafellsjökull in southeast Iceland, leaving thicker ice at the foot of the slope; that ice is now moving away and the mountainside has shifted 1 to 3 cm. Epicenter
- Kīlauea's north vent threw lava about 660 feet (200 m) high for six hours on 5 November 2026; the summit is now reinflating, with the next episode forecast for 16 to 21 November. Epicenter
- A crack up to 6 m (20 ft) wide is splitting the summit of the Hochvogel in the Allgäu Alps; 12 years of measurements now put the loose block at about 400,000 cubic metres, half the peak. Epicenter
