
A disturbance in the forest from Landsat perspective
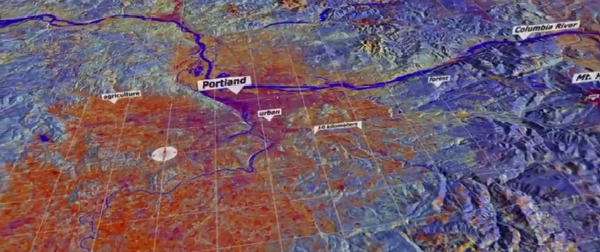
Image credit: TW
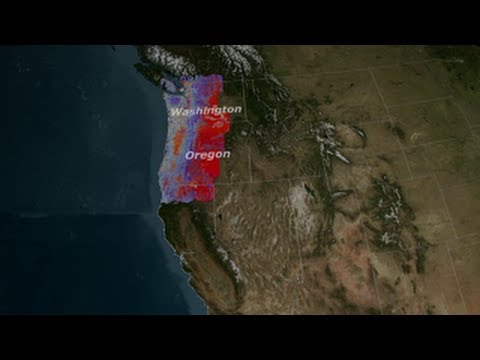
This is a sequence of Landsat-based data in the Pacific Northwest. There is one data set for each year representing an aggregate of the approximate peak of the growing season (around August). The data was created using a sophisticated algorithm called LandTrendr.
The visualization zooms into the Portland area showing different types of land such as agricultural, urban, and forests, then move south to a region that was evergreen forest for a number of years (blue), then was clear cut in 1999 (orange), then began to regrow (yellow). A graph shows the history for a particular location in the clearcut as the years repeat. The dots represent the original data from Landsat; and, the line represents LandTrendr analysis.
Subsequent sequences examine the effects of insect infestations in the Three Sisters region, southwest of Mt. Hood, and east of Mt. Rainier. The final piece demonstrates the visible differences in management policy between forests inside and outside of National Park Service boundaries.
Credit: NASAexplorer

Published in the last 24 hours
- High Risk of excessive rainfall covers Florida’s Space Coast as St. Johns River near Cocoa reaches 5.67 m
- Asteroid 2026 WJ to pass Earth at 1.7 lunar distances at 04:20 UTC on November 22, with 2026 WD following at 4.4 lunar distances on November 23
- Cyclone Akvan crossed the north Andhra Pradesh and south Odisha coasts close to Gopalpur on November 20 with 70-80 km/h winds gusting to 90, and has weakened into a deep depression
- A broad low over southeastern Florida and the northwestern Bahamas has a 30 percent chance of subtropical or tropical development within 48 hours and a 50 percent chance within 7 days, the National Hurricane Center says

We have for far to long abused our world. It’s time to pay or clean. I say Lets clean.