
Deadly Rainfall Over Thailand
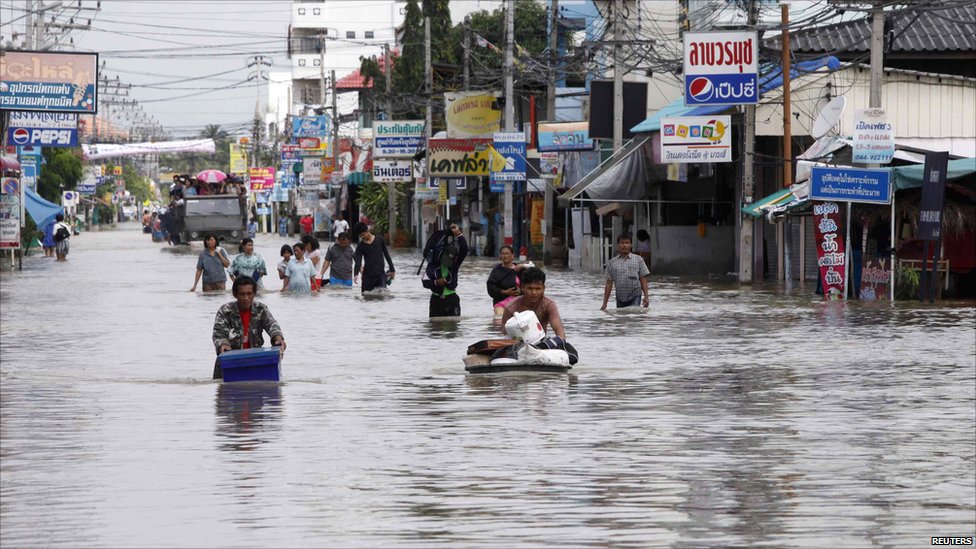
Image credit: TW
Data from NASA’s Tropical Rainfall Measuring Mission or TRMM satellite was used to create a rainfall map of the severe rains that fell in Thailand recently. More than 20 people have been killed in southern Thailand over the past week due to flooding and mudslides caused by extremely heavy rainfall.
TRMM is a satellite managed by both NASA and the Japanese Space Agency, JAXA. It is a unique satellite because its advanced technology enables it to measure rainfall from space.

A Multi-satellite Precipitation Analysis (TMPA) analysis was made using data that were calibrated with TRMM precipitation data. These data are calculated and stored at NASA’s Goddard Space Flight Center in Greenbelt, Md. and are available within a few hours after being received by satellites. The analysis showed that rainfall for the past week over the Malay Peninsula was particularly extreme with totals of almost 1200 mm (~47 inches).
TRMM satellite data revealed that rainfall in that area was frequently falling at a rate of over 50 mm/hr (~2 inches). According to reports from CNN, since March 26 the southern province of Surat Thani received 855 mm (34 inches) of rain. Normally, the province receives about 2 inches of rainfall over the entire month of March. Heavy rain amounts (from satellite data) and flood inundation calculations (from a hydrological models) are updated every three hours globally with the results shown on the “Global Flood and Landslide Monitoring” TRMM web site pages http://trmm.gsfc.nasa.gov/
More than 15 people have been killed in Thailand over the past week due to flooding and mudslides caused by extremely heavy rainfall. The Multisatellite Precipitation Analysis (TMPA) analysis above was made using data that were calibrated with TRMM precipitation data. These data are calculated and stored at NASA Goddard Space Flight center and are available within a few hours after being received by satellites. This analysis shows that rainfall for the past week over the Malay Peninsula was particularly extreme with totals of almost 1200 mm (~47 inches). TRMM satellite data revealed that rainfall in that area was frequently falling at a rate of over 50 mm/hr (~2 inches).
Heavy rain amounts (from satellite data) and flood inundation calculations (from a hydrological models) are updated every three hours globally with the results shown on the “Global Flood and Landslide Monitoring. (TRMM)

In regions like Chiang Rai, Chiang Mai and Mae Hong Son; the rainy season often begins in May. Rainfall may dwindle in November .. or the month may finish in a flourish .. with flash flooding. The South can often be dry in June.
Another factor that complicates one effect of rainy season .. flooding .. is ground saturation. As ground saturation occurs, streams and rivers swell from the additional runoff. And since rivers flow downhill, than means toward the sea .. and many of them .. toward Bangkok. It’s rare to experience all-day steady rain. It’s also unusual to have a week with rain every day.
A typical rainy day during the middle of Thailand’s rainy season will have dry mornings followed by rain in the afternoon. The heaviest rain seems to fall at night. But fortunately, mid rainy season rainfall is seldom cold. While it may be cool, it tends to be more refreshing than not .. For some reason known only to mother nature, Chiang Rai often gets a violent rainstorm, winds and hail .. yes, hail .. during Songkran. What should be the the driest part of the year can turn into a shivering, awe inspiring experience.
| ||||||||||||||||||||||||||||||||||||||||||||||||||||
- Thailand’s climate receives an average of 1492 mm (58.7 in) of rainfall per year, or 124 mm (4.9 in) per month.
- On average there are 88 days per year with more than 0.1 mm (0.004 in) of rainfall (precipitation) or 7.3 days with a quantity of rain, sleet, snow etc. per month.
- The driest weather is in December when an average of 7 mm (0.3 in) of rainfall (precipitation) occurrs across 1 days.
- The wettest weather is in September when an average of 306 mm (12.0 in) of rainfall (precipitation) occurrs across 15 days. (ClimateTemp)

http://trmm.gsfc.nasa.gov/publications_dir/tri_day_2.html
Commenting rules and guidelines
We value the thoughts and opinions of our readers and welcome healthy discussions on our website. In order to maintain a respectful and positive community, we ask that all commenters follow these rules.