
Fastest magnetic-field weakening occurs away from South Atlantic Anomaly’s second minimum, Swarm study finds
Researchers using Swarm satellite and ground-based magnetic measurements found that the fastest decline in total magnetic-field intensity near the South Atlantic Anomaly’s second minimum occurs at 4.55°E, 32.61°S, separate from the minimum at 0.55°W, 40.60°S. Their regional model tracked the minimum from 2014.5 to 2024.5 and recorded non-uniform motion after 2021.0.
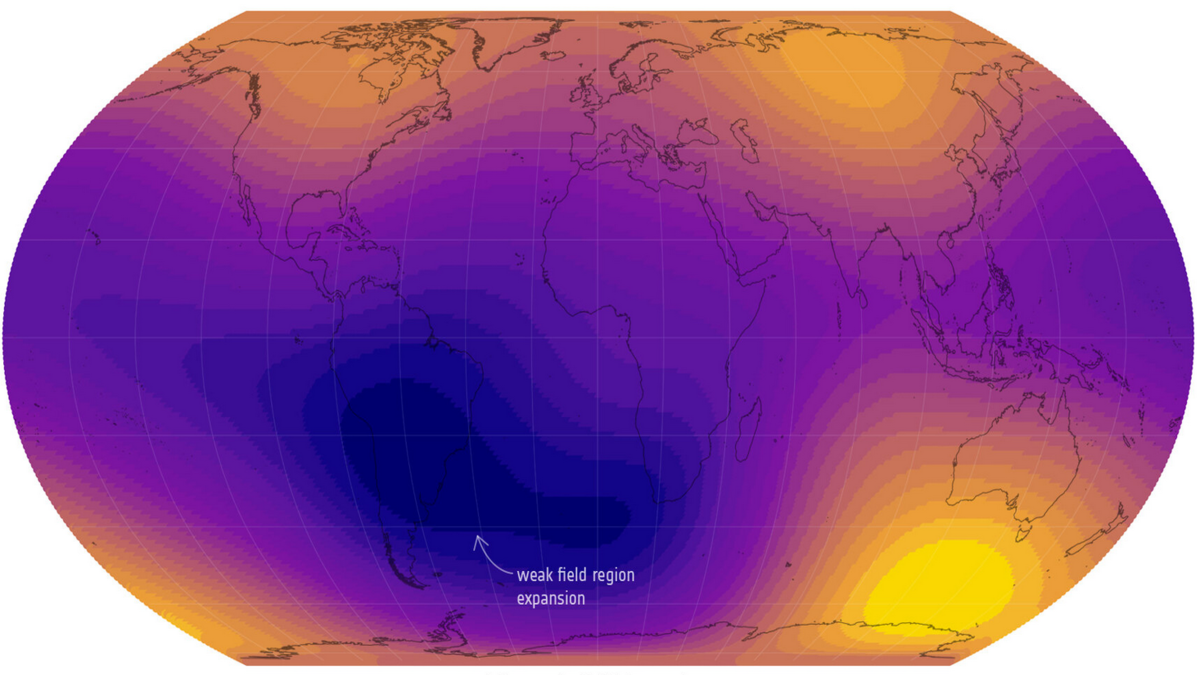
South Atlantic Anomaly 2025. Credit: ESA
Khanyile, Nahayo and Habarulema (2026) developed a regional geomagnetic-field model using Revised Spherical Cap Harmonic Analysis, or R-SCHA, to examine the eastern minimum of the South Atlantic Anomaly in greater spatial detail.
The model combines satellite and ground-based magnetic measurements and was evaluated against CHAOS-8.1, a global model of Earth’s magnetic field. The study was made available online on August 4, 2026, in Physics of the Earth and Planetary Interiors as article 107591 and is currently listed by the publisher as an in-press journal pre-proof.
The R-SCHA solution produced root-mean-square errors of 2.1 nT for the X component, 1.1 nT for Y and 0.8 nT for Z when compared with its input data. Corresponding values obtained with CHAOS-8.1 were 2.5, 1.8 and 1.3 nT. The smaller residuals provided the authors with a regional representation from which they followed changes in the total-field minimum through the Swarm observation period.
Tracking from epoch 2014.5 through 2024.5 produced movement in both longitude and latitude. The authors describe a complex migration pattern involving longitudinal and latitudinal changes, with non-uniform motion after epoch 2021.0.
The strongest decrease in total magnetic-field intensity was located at 4.55°E, 32.61°S, while the second minimum was centered at 0.55°W, 40.60°S at the position identified by the study. Secular-variation calculations assigned the largest average contribution to the Z component, at about 81 nT/year, followed by approximately 29 nT/year from Y and 22 nT/year from X.
The spatial separation distinguishes the location where total magnetic-field intensity is lowest from the location where the field is decreasing most rapidly. Those positions do not have to coincide, and the 2014.5–2024.5 analysis places them at distinct locations.
Khanyile and colleagues extended the modeled field at the two positions using constant averaged secular-acceleration values estimated over the study period. Under that specific assumption, the faster-decreasing position would record the lowest total-field intensity in the region around 2048. The 2048 date is an extrapolated result that depends on holding the estimated average secular acceleration constant; it is not an observed future state.

Secular acceleration describes changes in the rate of secular variation of Earth’s magnetic field. Using CHAOS-8.1, the authors found positive secular acceleration and a reduced rate of field decrease at the SAA’s first minimum, while the second minimum showed negative secular acceleration together with an increasing rate of decrease. The two minima therefore followed different temporal behavior in the model over the period analyzed.
The eastern minimum predates the new analysis. Finlay et al. (2020), using the CHAOS-7 geomagnetic-field model and six years of Swarm observations, resolved a distinct secondary surface minimum near 40°S on the Greenwich meridian. Their analysis connected the feature with the movement and evolution of reversed magnetic flux beneath South Africa at the core-mantle boundary and found that development of the broader South Atlantic Anomaly was more complex than the westward motion and expansion of a single weak-field region.
The CHAOS-7 analysis also showed declining field intensity on the anomaly’s western side and a marked decrease along its southeastern edge toward southern Africa. At Earth’s surface, the field decrease was distributed unevenly, including strong changes southwest of South Africa where the secondary minimum developed. The 2020 analysis attributed the surface structure to the combined effects of multiple non-dipolar magnetic-flux features rather than a single core-mantle-boundary feature.

A separate ESA analysis released on October 13, 2025, used 11 years of Swarm measurements to examine broader changes in the anomaly. ESA reported that the weak-field region had expanded by an area approaching half the size of continental Europe since 2014 and that the South Atlantic southwest of Africa had undergone faster weakening since around 2020. The ESA analysis concerned a separate Swarm study and provides context for the larger regional evolution; it was not a press release for the Khanyile et al. paper.
ESA’s Swarm mission comprises three satellites designed to precisely measure magnetic signals associated with Earth’s core, mantle, crust and oceans, together with contributions from the ionosphere and magnetosphere. The constellation was launched on November 22, 2013, providing the long magnetic record covering the full interval examined in the new regional study.
The South Atlantic Anomaly also has an operational spaceflight dimension because the weaker geomagnetic field allows energetic particles to penetrate farther into the near-Earth environment. ESA reports that satellites traversing the region encounter higher radiation exposure, with possible electronic malfunctions and hardware damage. The 2026 Khanyile study analyzes magnetic-field evolution and does not itself quantify a new rate of spacecraft failures or a new radiation hazard.
References:
1 Khanyile, S. L., Nahayo, E., & Habarulema, J. B. (2026). Evolution of the South Atlantic Anomaly’s second minimum using Swarm satellite dataset (2014–2024). Physics of the Earth and Planetary Interiors. Advance online publication, Article 107591. https://doi.org/10.1016/j.pepi.2026.107591
2 Finlay, C. C., Kloss, C., Olsen, N., Hammer, M. D., Tøffner-Clausen, L., Grayver, A., & Kuvshinov, A. (2020). The CHAOS-7 geomagnetic field model and observed changes in the South Atlantic Anomaly. Earth, Planets and Space, 72, Article 156. https://doi.org/10.1186/s40623-020-01252-9

I’m a science journalist and researcher at The Watchers, contributing to the Epicenter edition, where I cover peer-reviewed scientific research and emerging discoveries across Earth and space sciences. With a background in astronomy and a passion for environmental science, I’ve worked in shark and coral conservation in Fiji, conducting reef and shark-behavior research, contributing to mangrove restoration, and earning PADI Open Water and Coral Reef Certifications. I bring a blend of scientific rigor and storytelling to illuminate the discoveries shaping our planet and beyond.

Lee H, I would encourage you to keep learning and asking ‘why?’
Premise here is exactly a launch-pad for critical thought, building on some existing knowledge as you describe well, not letting others do the thinking for you, with their unseen bias, well-noticed and well said; like a different broadcast channel.
Stunning insights regularly on this strand, I would encourage you to stick with it if you find it even a tiny bit interesting, also AI can do some great personalised break-downs and summaries. Agree with the outlets you highlight very good, The Watchers often gives absolute gems that focus on facts not subtle manipulations that one realises with Ars-T in particular, no affiliation. Lee, I hope to see you around here again soon, regards.
Vector potentials (1/r), see the B-field arc, see the torque?…Map to the ECDO framework Euler axis, interesting. With continuing gratitude to our author, and SWARM.
Repeating what is said in studies is okay if the topic is in your field of study, or perhaps if you have a general science background. But for a layperson such as myself, it’s only so much gobbledygook. I would appreciate it if the writer would tell the reader what all of this means in a more meaningful way that can be understood in something closer to everyday terms. See Quanta or ArsTechnica. Thank you.