
The fickle El Nino of 2014
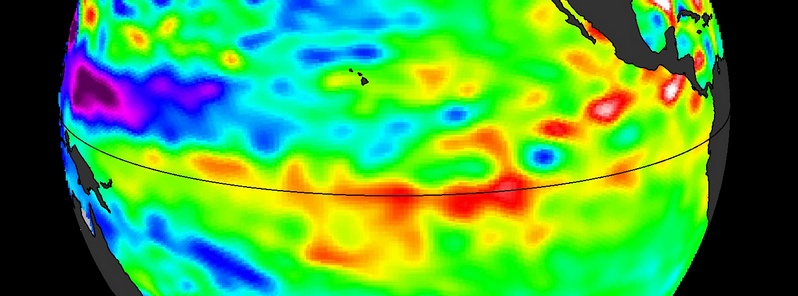
Image credit: TW
Prospects have been fading for an El Niño event in 2014, but now there's a glimmer of hope for a very modest comeback. Scientists warn that unless these developing weak-to-modest El Niño conditions strengthen, the drought-stricken American West shouldn't expect any relief.
The latest sea-level-height data from the NASA/European Ocean Surface Topography Mission (OSTM)/Jason-2 satellite mission show a pair of eastward-moving waves of higher sea level, known as Kelvin waves, in the Pacific Ocean – the third such pair of waves this year. Now crossing the central and eastern equatorial Pacific, these warm waves appear as the large area of higher-than-normal sea surface heights (warmer-than-normal ocean temperatures) hugging the equator between 120 degrees west and the International Dateline. The Kelvin waves are traveling eastward and should arrive off Ecuador in late September and early October.
A series of larger atmospheric "west wind bursts" from February through May 2014 triggered an earlier series of Kelvin waves that raised hopes of a significant El Niño event. Just as the warming of the eastern equatorial Pacific by these waves dissipated, damping expectations for an El Niño this year, these latest Kelvin waves have appeared, resuscitating hopes for a late arrival of the event.
Climatologist Bill Patzert of NASA's Jet Propulsion Laboratory, Pasadena, California, says it's too early to know for sure, but he would not be surprised if the latest Kelvin waves are the "last hurrah" for this much-hoped-for El Niño. "Since February 2014, the prospect of an El Niño has waxed and waned. This late in the season, the best we can expect is a weak to moderate event. What comes next is not yet clear. But for the drought-plagued American West, the possibility of a badly needed drenching is fading," said Patzert.
NASA scientists will continue to monitor the Pacific to see what is in store next for the world's climate.
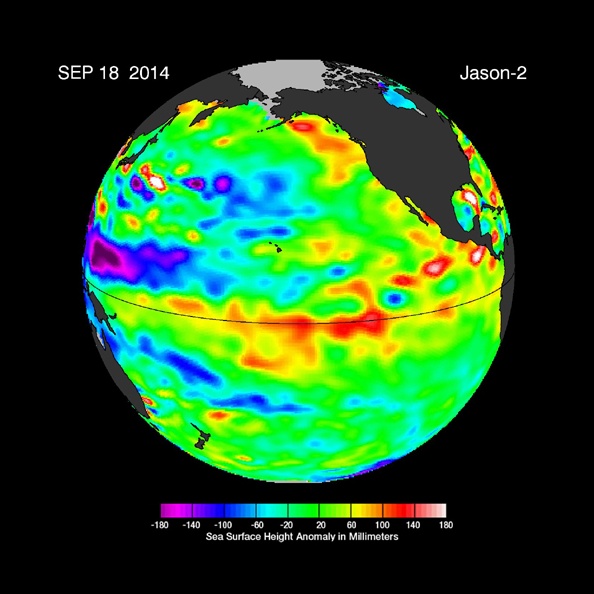
The image shows Kelvin waves of high sea level (red/yellow) crossing the Pacific Ocean at the equator. The waves can be related to El Niño events. Green indicates normal sea level, and blue/purple areas are lower than normal. Data are from the NASA/European Jason-2 satellite, collected Sept. 13-22, 2014. Image credit: NASA/JPL-Caltech
This image was created with data collected by the U.S./European OSTM/Jason-2 satellite during a 10-day period centered on September 18, 2014. It shows a red and yellow area in the central and eastern equatorial Pacific, indicating that the ocean surface is about 4 to 6 inches (10 to 12 centimeters) above normal. Green indicates near-normal conditions. These regions contrast with the western equatorial Pacific, where sea levels (blue and purple areas) are 3 to 6 inches (8 to 15 centimeters) lower than normal.
The height of the ocean water relates, in part, to its temperature, and thus is an indicator of the amount of heat stored in the ocean below. As the ocean warms, the water expands and the sea level rises; as it cools, its level falls. Above-normal height variations along the equatorial Pacific indicate El Niño conditions, while below-normal height variations indicate La Niña conditions. The temperature of the upper ocean can have a significant influence on weather patterns and climate.
This latest image highlights the processes that occur on time scales of more than a year but usually less than 10 years, such as El Niño and La Niña. The image also highlights faster ocean processes such as Kelvin waves. As Patzert says, "Jason-2 is a fantastic Kelvin wave counter." These processes are known as the interannual ocean signal. To show that signal, scientists refined data for this image by removing trends over the past 21 years, seasonal variations and time-averaged signals of large-scale ocean circulation. For a more detailed explanation of what this type of image means, visit: http://sealevel.jpl.nasa.gov/science/elninopdo/latestdata/
The comings and goings of El Niño and La Niña are part of the long-term, evolving state of global climate, for which measurements of sea surface height are a key indicator.
For a time sequence of the evolution of the 2014 El Nino, visit: http://sealevel.jpl.nasa.gov/science/elninopdo/latestdata/archive/
Source: NASA / JPL-Caltech
Feautred image credit:NASA/JPL-Caltech
The Watchers team and our contributors bring the latest on extreme weather, earthquakes, volcanic eruptions, space weather, and all things science. We're all about making sense of the natural world and keeping you informed on what’s happening. Got a tip or a question? Hit us up using the form at newstips!
Commenting rules and guidelines
We value the thoughts and opinions of our readers and welcome healthy discussions on our website. In order to maintain a respectful and positive community, we ask that all commenters follow these rules.