
NSDIC: Arctic & Antarctic Sea Ice Extent, 1979-2012 animated maps
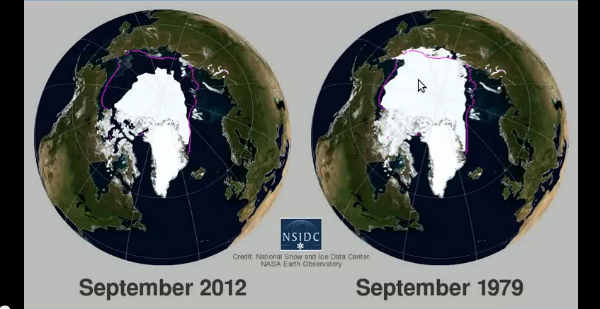
Image credit: TW
In October 2012, National Snow and Ice Data Center (NSIDC) released an animated map of 2012 Arctic and Antarctic sea ice extent shown side-by-side with 1979 – 2009 climatology.
For more information and visualizations of thinning sea ice, see the NOAA Climate Watch article, “Arctic Sea Ice Getting Thinner, Younger.”
Source: NSDIC

Published in the last 24 hours
- Male toads abandoned a pond in Italy five days before a deadly 2009 earthquake, while a scientist was counting them Epicenter
- An asteroid was spotted 19 hours before it exploded over Sudan in 2008, and students picked its pieces off the desert Epicenter
- A wave up to 3 m (10 feet) high rose out of Lake Michigan on a sunny June morning in 1954 and swept fishermen off Chicago’s piers, and when a second came 10 days later, warnings had cleared the shore Epicenter
- Just 12 inches of rushing water can carry away most cars, and more than half of US flood drownings happen to people who drive into flood water Epicenter

antarctica’s “continental climate” will keep it insulated from the effects of global warming to a certain extent. However, ice is a simple substance that behaves very simply. The hotter it gets, the more it melts. And one can’t argue against the fact that the ice in the Arctic has been melting quite a bit lately. Eventually, Antarctica will lose a great quantity of its ice too.