
Dimishing Arctic sea ice – CryoSat reveals facts about ice volumes
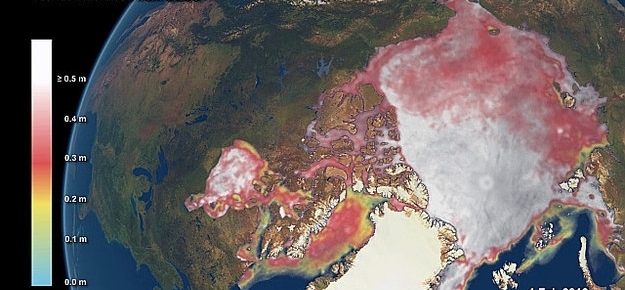
Image credit: ESA satellites looking deeper into sea ice
An international team of scientists led by University College London provided insight into decline of Arctic sea ice volume and generated estimates of the sea-ice volume for the 2010–11 and 2011–12 winters over the Arctic basin using data from ESA’s CryoSat satellite.
According to the study, volume of Arctic sea ice had reduced by 36% during autumn and 9% during winter between 2003 and 2012. For the first time, it has been validated that volume of sea ice and its extent in polar region has declined substantially in tandem.
Notably, there has been a constant downward trend in Arctic sea ice cover during all seasons, especially in summer, satellite data suggests. Last September, summer sea ice extent reached 3.61 million sq km and past six years have had lowest extent in three decades.
The new CryoSat dataset shows the volume’s continuing decline observed from 2003 to 2008 by NASA’s ICESat satellite. Since 2008, the Arctic has lost about 4300 cubic km of ice during the autumn period and about 1500 cubic km in winter. Katharine Giles, co-author of the study said, “The data reveal that thick sea ice has disappeared from a region to the north of Greenland, the Canadian Archipelago and to the northeast of Svalbard.”
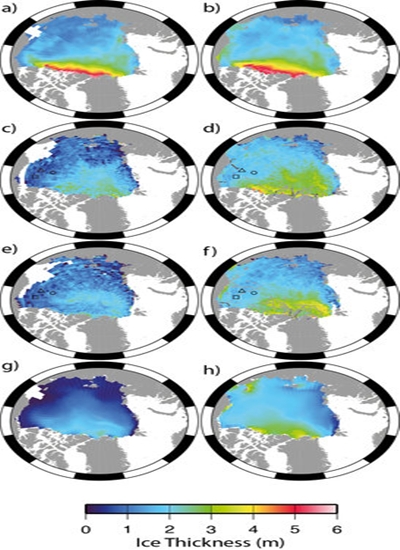 ICESat, CryoSat and PIOMAS sea ice thickness measurements in the Arctic. Figure (a) shows the 2003–07 average ICESat ice thickness for October/November and (b) the 2004–08 average for February/March. Figures (c) to (f) are measurements based on CryoSat data, for October/November 2010 (c), February/March 2011 (d), October/November 2011 (e) and February/March 2012 (f). The final two figures are based on PIOMAS measurements for October/November 2011 (g) and February/March 2012 (h).
Credits: K. Giles et al.
CryoSat estimates were confirmed by using independent ground and airborne measurements carried out by ESA and international scientists during the last two years in the polar region. They also compared measurements from NASA’s Operation IceBridge.
CrysoSat allows scientists to estimate changes in sea ice volume, whereas other satellites observe ice coverage. Tommaso Parrinello, CryoSat Mission Manager explains,
“Other satellites have already shown drops in the area covered by Arctic sea ice as the climate has warmed, but CryoSat allows scientists to estimate the volume of sea ice – a much more accurate indicator of the changes taking place in the Arctic.”
To do this, CryoSat’s high-resolution radar altimeter sends pulses of microwave energy down towards the ice. The energy bounces off both the top sections of ice and the water in the cracks between. The difference in height between these two surfaces allows scientists to calculate the ‘freeboard’ – the height of ice above the water – and, as a result, volume of the ice cover.
While the researchers say two years of CryoSat data aren’t indicative of a long-term change, they speculate that the lower ice thickness and volume in the winter of 2012, compared to the winter of 2011, may have contributed to the record minimum ice extent during the 2012 autumn.
Time-series of monthly Arctic sea ice volume from CryoSat (red circles) and from PIOMAS (solid line) for two winter growth periods (October – April) can be watched here.
Source: ESA
Some links to past arctic ice melt, seems its been around for a good hundred years or so and land hasn’t flooded and we are still here.
http://paperspast.natlib.govt.nz/cgi-bin/paperspast?a=d&d=ST18730328.2.20
http://news.google.com/newspapers?id=PiohAAAAIBAJ&sjid=W34EAAAAIBAJ&pg=6753,466596&dq=arctic+ice+free&hl=en 1956 Arctic warming
1952 Ports will be swamped by melting ice http://trove.nla.gov.au/ndp/del/article/27078543?searchTerm=greenland%20ice%20melting&searchLimits=
Seems global warming was around in the 50’s. Heaven forbid, could this mean that it’s a cycle? http://trove.nla.gov.au/newspaper/result?q=greenland+ice+melting
http://trove.nla.gov.au/ndp/del/article/9827111