
New York and New Orleans among most flood-prone U.S. cities, new study shows
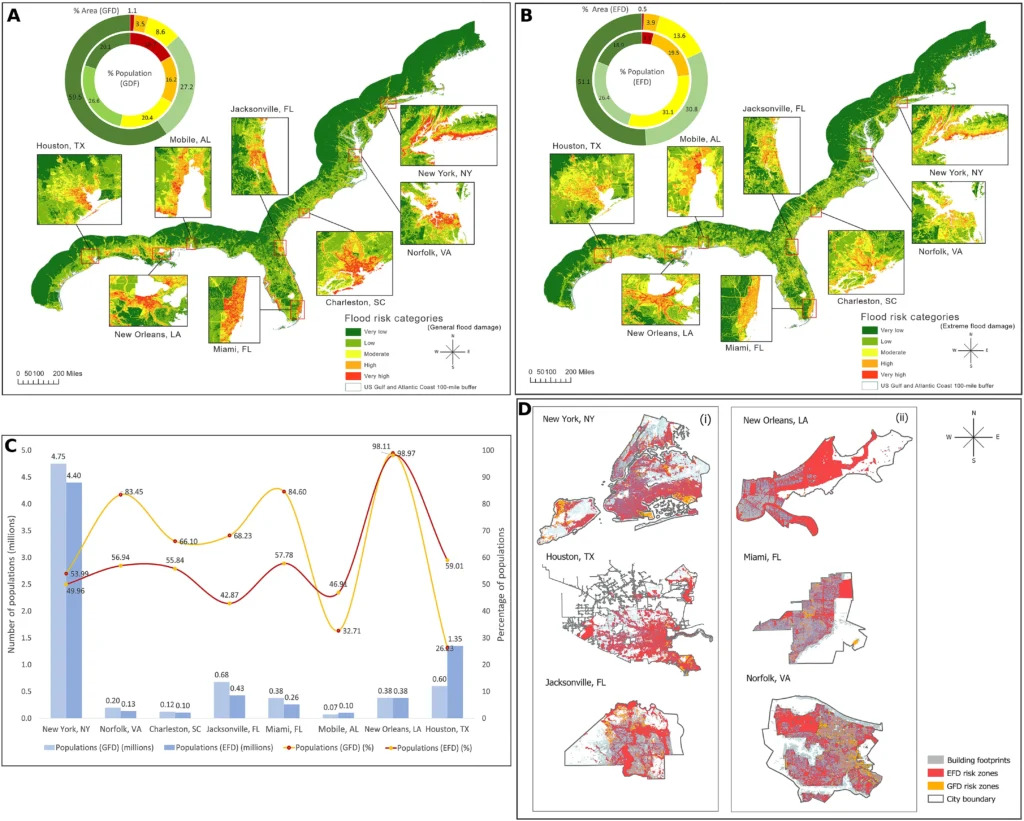
Flood risk along the U.S. Gulf and Atlantic coasts affects a disproportionate share of the population, with 16.7% living in very high-risk zones that cover just 1.1% of land, according to a new study. New York City and New Orleans rank among the most exposed urban areas, with up to 4.75 million residents at risk in New York and nearly 99% of New Orleans’ population located in flood-prone zones. High-risk areas account for another 3.5% of land but include 16.21% of residents.
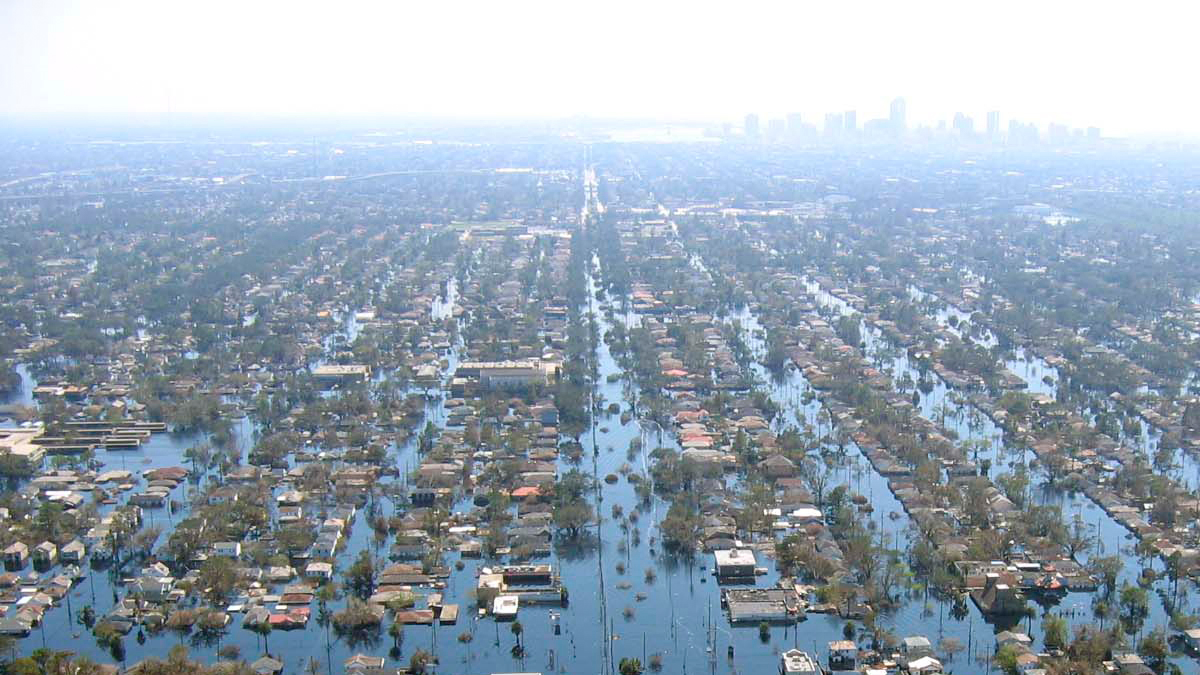
View of flooded New Orleans in the aftermath of Hurricane Katrina. Credit: Mark Moran/ NOAA
Flooding remains the costliest natural disaster in the United States, with increasing risk along coastal regions where sea level rise and storm-driven events continue to elevate risk.
A study led by Hemal Dey and Wanyun Shao examines the U.S. Gulf and Atlantic coasts using a 161 km (100 miles) inland buffer, integrating hazard conditions, population exposure, and socioeconomic vulnerability to assess flood risk at fine spatial scales.
Researchers used data from the Federal Emergency Management Agency (FEMA) to analyze nearly 52 710 damage points for general flood damage (GFD) and 19 272 points of extreme flood damage (EFD). A total of 16 flood risk factors, representing hazard, exposure, and vulnerability, were used along with machine learning to analyze flood risk.
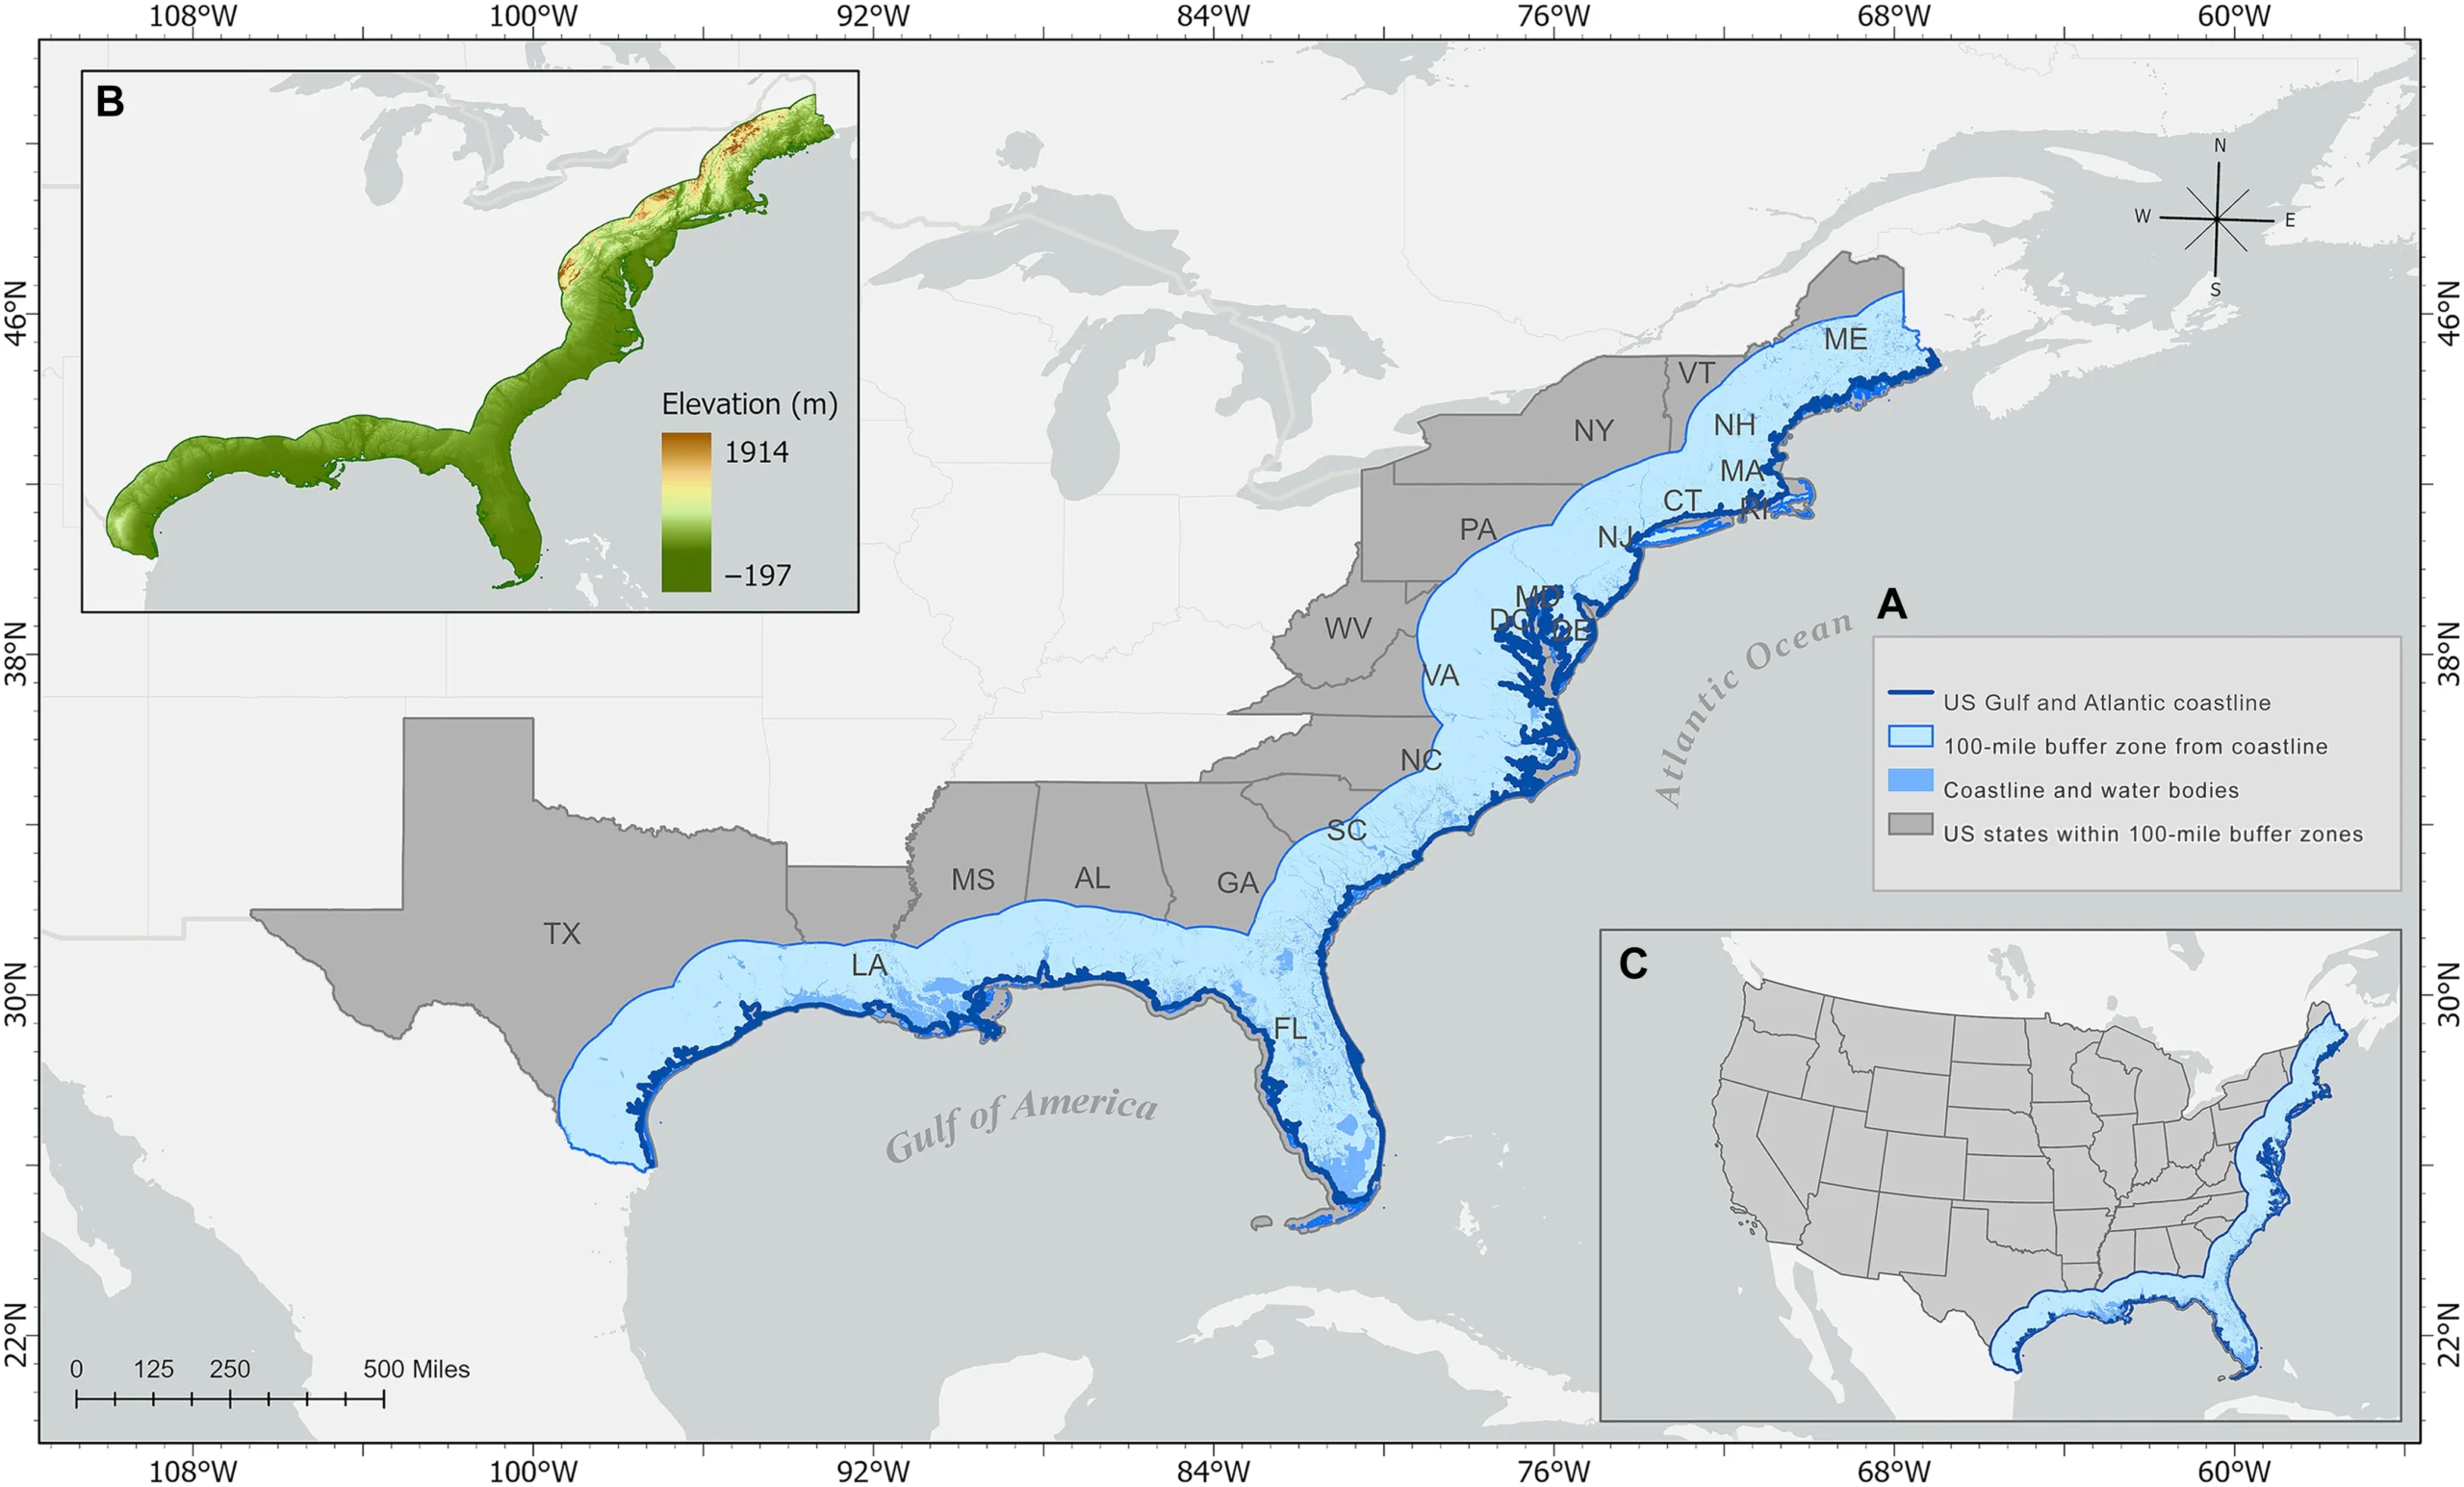
100-mile buffer zones from the US Gulf and Atlantic coastlines. (B) Elevation map of the USGAC. (C) Location of the USGAC in the context of the CONUS. Credit: Hemal Dey and Wanyun Shao/Science Advances
The study found that a significant population along the Gulf and Atlantic coasts lives in high flood-risk areas; however, only a small portion of the land falls within high and very high flood-risk categories.
Areas classified as very high risk account for about 1.1% of the total study region, while high-risk areas cover roughly 3.5%. Despite this limited spatial footprint, approximately 16.7% of the population is located in very high-risk areas and 16.21% in high-risk areas.
Eight coastal cities were identified as particularly vulnerable: New York, Norfolk, Charleston, Jacksonville, Miami, Mobile, New Orleans, and Houston.
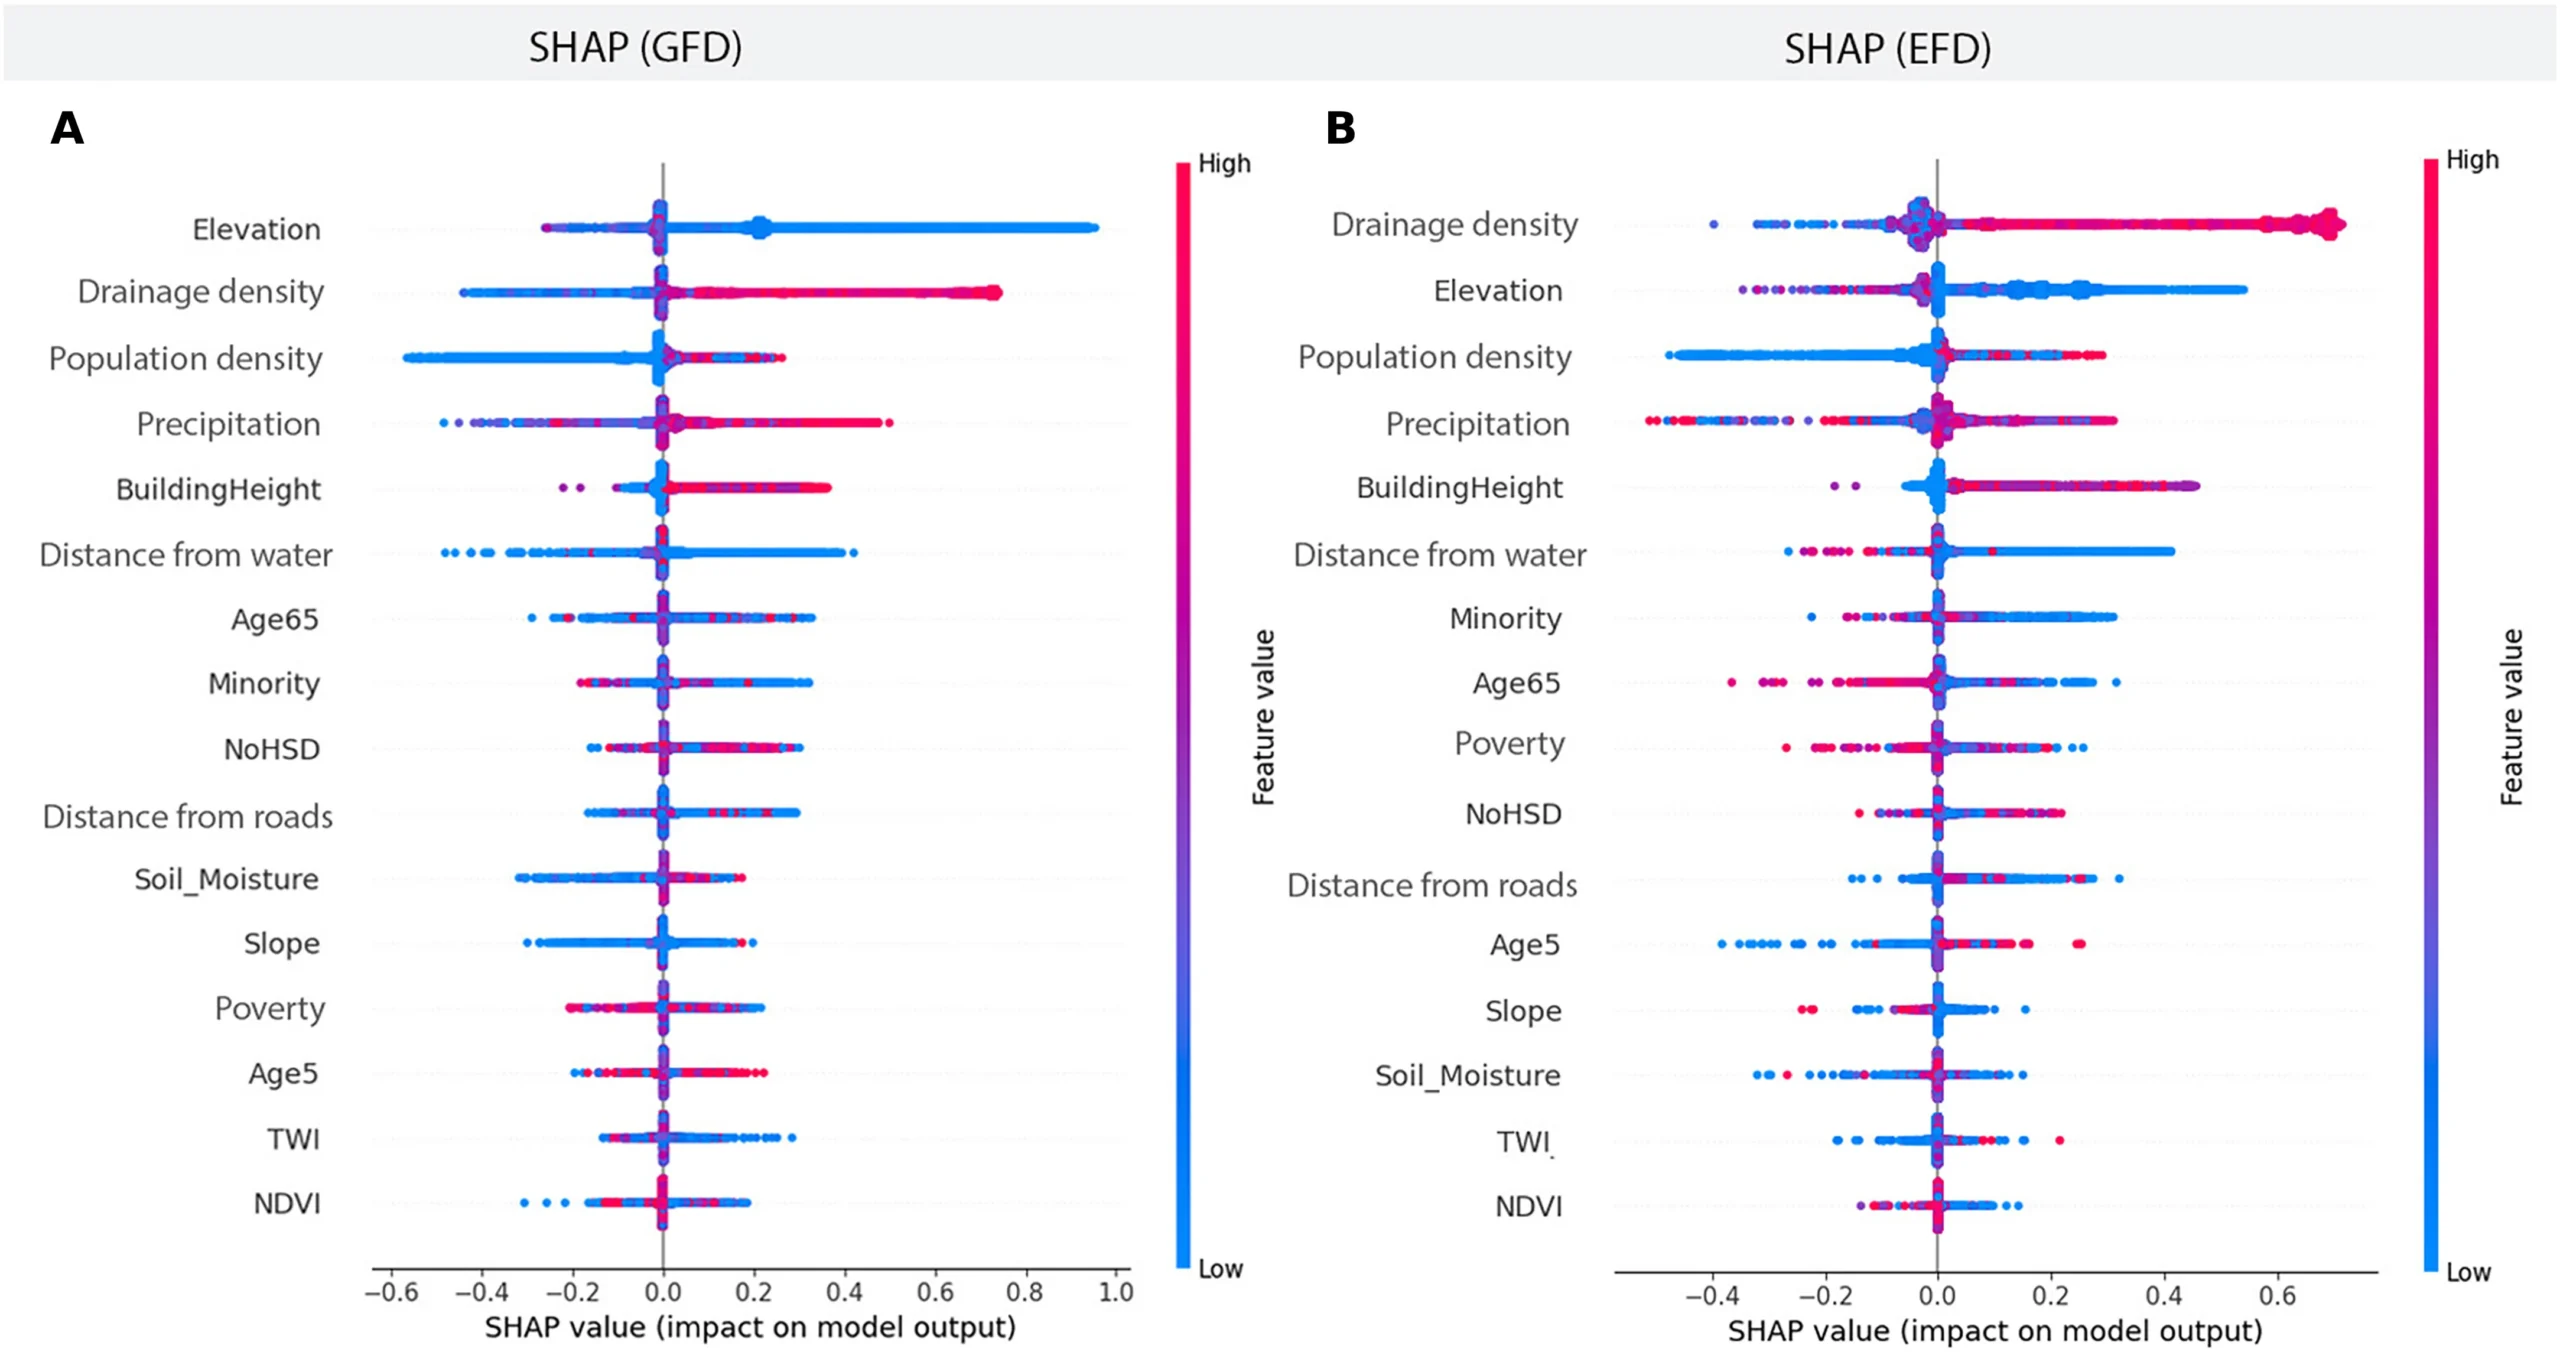
(A) Ranks of underlying FRFs for GFD. (B) Ranks of underlying FRFs for EFD. The x axis represents SHAP values, where positive values indicate a higher contribution to flood risk and negative values indicate a lower contribution. The primary y axis lists the FRFs, whereas the secondary y axis shows the corresponding value ranges of these FRFs. Red points represent higher FRF values, whereas blue points represent lower values. Credit: Hemal Dey and Wanyun Shao/Science Advances
New York City has the largest number of people exposed to flooding, with approximately 4.75 million residents at risk under general flood damage conditions and 4.40 million under extreme damage scenarios. New Orleans shows the highest relative exposure, with about 99% of its population located in flood-prone areas under both scenarios.
Traditional flood risk assessments have largely focused on physical hazard indicators such as precipitation, elevation, and hydrological processes. While valuable, these approaches often overlook the critical roles of population and infrastructure exposure and vulnerability in affected areas.
Researchers have identified size-dominant variables for flood risk in urban areas; these include elevation, drainage, population density, precipitation, building height, and distance from water.
Results show that low elevation is the strongest driver in GFD scenarios, as it allows water to accumulate easily, increasing flood risk.
Meanwhile, drainage density, which is the total length of rivers and streams per unit area, is the main factor affecting EFD scenarios. This is because higher drainage density leads to faster runoff, higher peak flows, and sudden water surges, creating conditions for dangerous flash floods.
While these two factors play a major role, another factor worsens conditions in urban areas: infrastructure. Roads, concrete, and buildings block the absorption of water into the soil, allowing precipitation to accumulate and turn into runoff that drains into streams and rivers, raising their water levels.
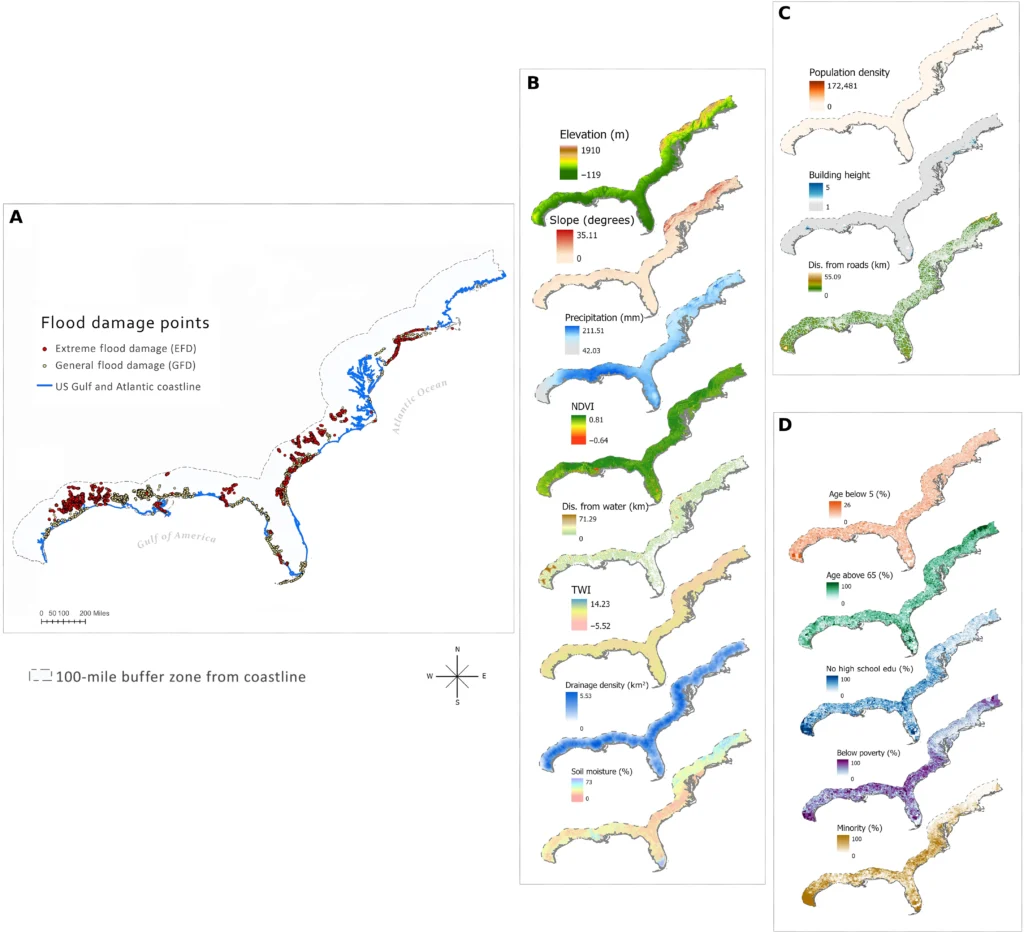
(A) Locations of flood damage along the USGAC. Yellow dots represent the locations of the GFD location, whereas red dots represent the locations of the EFD location. (B) FRFs from hazard. (C) FRFs from exposure. (D) FRFs from vulnerability. Credit: Hemal Dey and Wanyun Shao/Science Advances
The study used the examples of New York and New Orleans to demonstrate how different factors affect flood risk in these cities.
In New York, about 15% of the city’s total area is within a 100-year flood zone, with risk driven by both natural and man-made factors. Tropical cyclones and storms tend to bring heavy precipitation to the region. This, combined with urban development, allows more runoff on roads as water has no place to go.
Subsequently, it overwhelms sewer systems that are already outdated and were not designed to handle modern flooding and drainage demands. The resulting backflow due to reduced drainage adds to the overall risk in the region.
Historical development on landfills over tidal marshes and nearshore zones, along with extensive dredging in areas such as Jamaica Bay, has made the city highly vulnerable to coastal flooding.
Meanwhile, the city is also sinking, with estimated land subsidence at a rate of 1 to 2 mm/year (0.03 to 0.07 inches/year), caused by excessive groundwater pumping and dredging, exacerbating overall flood risk.
New Orleans, on the other hand, is more affected by natural factors than man-made ones. The First Street Foundation projects that in 30 years, a 100-year flood could affect 148 952 properties, representing 99.6% of all properties in New Orleans. This aligns with findings that nearly 99% of the city’s population is at high risk of flooding under both GFD and EFD scenarios.
The city sits in a bowl-shaped basin below sea level, bordering the Mississippi River, Lake Pontchartrain, and the Gulf of Mexico.
Annual precipitation exceeds 1 600 mm (63 inches) on average in the city, which relies mostly on pumps and levees to drain water, as normal gravity-driven drainage systems fail due to the low elevation.
This is further worsened by significant land subsidence rates of approximately 6.4 mm/year (0.25 inches/year), with localized rates reaching up to 33 mm/year (1.29 inches).
Flood risk along the US Gulf and Atlantic coasts is highly concentrated, with a small share of land accounting for a disproportionately large exposed population.
Projections indicate that by 2050, an additional 1 301–1 777 km2 (500–600 miles2) of urban coastal area could face high-tide flooding, placing USD 28–85 billion in property at risk and affecting millions. Current assessments show that nearly 60% of census blocks along the Gulf Coast already fall within high- to very high-risk zones.
Multiple steps need to be taken to mitigate rising flood risk in these regions, including green, blue, and gray infrastructure development, along with restrictions on urban development in high-risk zones.
Green infrastructure includes the creation of grasslands, gardens, bioswales, and other permeable areas within cities to allow water to reach the soil and be absorbed before turning into runoff.
Meanwhile, blue infrastructure focuses on the restoration of natural wetlands, river floodplains, and estuaries. These can be connected to urban drainage and sewage networks to reduce flood risk by allowing faster discharge of water from cities.
Gray infrastructure, such as levees, dikes, floodgates, embankments, and seawalls, remains essential but should complement rather than replace nature-based solutions, according to the researchers.
In addition, efficiently designed pumping and sewer systems need to be further enhanced to ensure the rapid evacuation of floodwater. In parallel, flood communication systems, including early warning and public alert tools, should be strengthened and modernized. Reducing false alarms must be prioritized to improve public trust, response effectiveness, and overall risk perception.
References:
1 Hemal Dey, Wanyun Shao, A tale of two coasts: Unveiling US Gulf and Atlantic coastal cities at high flood risk. Sci. eaec2079 (2026). DOI: 10.1126/sciadv.aec2079

I am an Assistant Editor and Severe Weather & Science Journalist at The Watchers, specializing in real-time severe weather coverage, geophysical event reporting, and research-driven scientific analysis. You can reach me at rishav(at)watchers(.)news.
Commenting rules and guidelines
We value the thoughts and opinions of our readers and welcome healthy discussions on our website. In order to maintain a respectful and positive community, we ask that all commenters follow these rules.