
Filament eruption, spotless Sun, Total Solar Irradiance and cosmic radiation
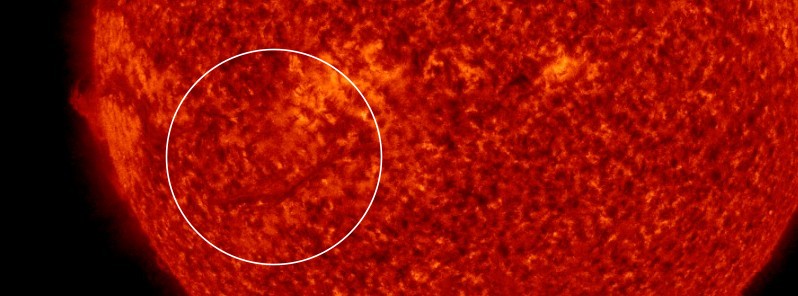
Featured image: Solar filament eruption on December 15, 2017. Credit: NASA/SDO AIA 304. Edit: TW
A 13-degree long plasma filament eruption was observed in SDO/AIA 304 imagery starting at 12:29 UTC on December 15, 2017. A glancing blow is expected late December 19, in combination with a recurrent, positive polarity CH HSS. Meanwhile, solar activity is at very low levels, the Sun is increasingly spotless and we are marching into Solar Minimum, low Total Solar Irradiance and increased cosmic radiation.
A slow-moving Coronal Mass Ejection (CME) was observed in LASCO C2 imagery, first visible at 14:48 UTC on December 15. The ENLIL model analysis of this filament eruption suggests a southeasterly trajectory with a radial velocity of approximately 245 km/s, SWPC forecasters said. Based on this transit speed any potential impacts to the Earth's magnetosphere should occur late December 19, in conjunction with a recurrent, positive polarity Coronal Hole High Speed Stream (CH HSS).
Over the past 24 hours, the greater than 2 MeV electron flux was at normal to moderate levels with a peak flux of 247 pfu observed at 22:15 UTC, December 16. An increase to moderate to high levels is expected on December 18 and 19 in response to elevated wind speeds from a recurrent CH HSS. The greater than 10 MeV proton flux is at background levels and expected to remain at those levels over the next 3 days.
Solar wind parameters over the past 24 hours indicated background conditions through about 21:00 UTC on December 16. Solar wind speeds ranged between 320 – 350 km/s while the total magnetic field strength remained below 2 nT and the Bz component between +2 nT and -3 nT.
After 21:00 UTC on December 16, a Co-Rotating Interaction Region (CIR) signature became evident. Bt increased sharply to 10 nT and further increased to 14 nT at 08:00 UTC today. The Bz component indicated increased variability between +11 nT and -9 nT. Wind speeds increased initially to about 375 km/s, hit the first maximum of near 500 km/s at about 08:15 UTC and reached 550 km/s by 12:30 UTC. Phi angle was oriented in a mostly positive solar sector over the past 24 hours.
Elevated solar wind parameters are expected to continue through the rest of the UTC day due to CIR/CH HSS effects. On December 18 through 19, wind parameters are expected to exceed 600 km/s. An additional enhancement is possible late December 19 due to glancing blow impacts from the December 15 CME.
The geomagnetic field briefly reached G1 – Minor geomagnetic storm levels today and is expected to remain at mostly unsettled to isolated G1 levels through the rest of the day due to CIR/CH HSS effects. G1 – Minor levels are expected to persist on December 18 and 19 due to CH HSS influence coupled with potential glancing blow effects from the December 15 CME.
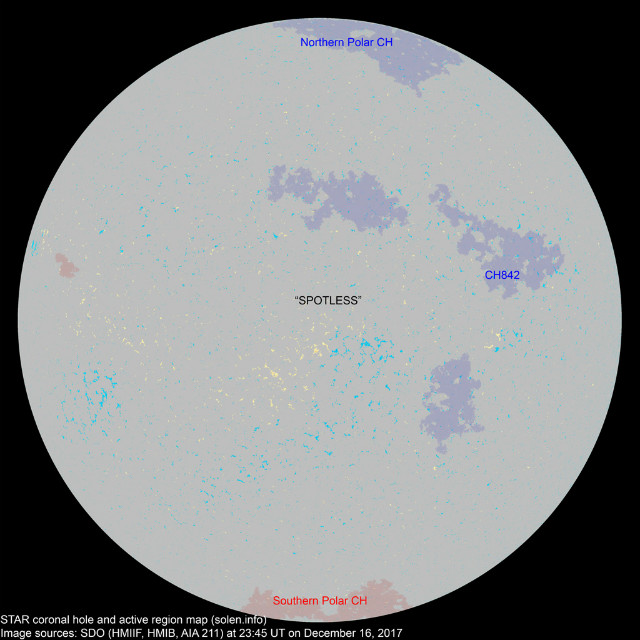
Meanwhile, solar activity is at very low levels and the solar disk is increasingly spotless. We are marching into Solar Minimum, low Total Solar Irradiance and high cosmic radiation.
Marching into Solar Minimum
At the same time as the sunspot cycle plunges toward its 11-year minimum, Total Solar Irradiance (TSI) is declining too. Across the entire electromagnetic spectrum, the Sun's output has dropped nearly 0.1% compared to the Solar Maximum of 2012-2014.
The plot shows the TSI since 1978 and annual sunspot numbers:
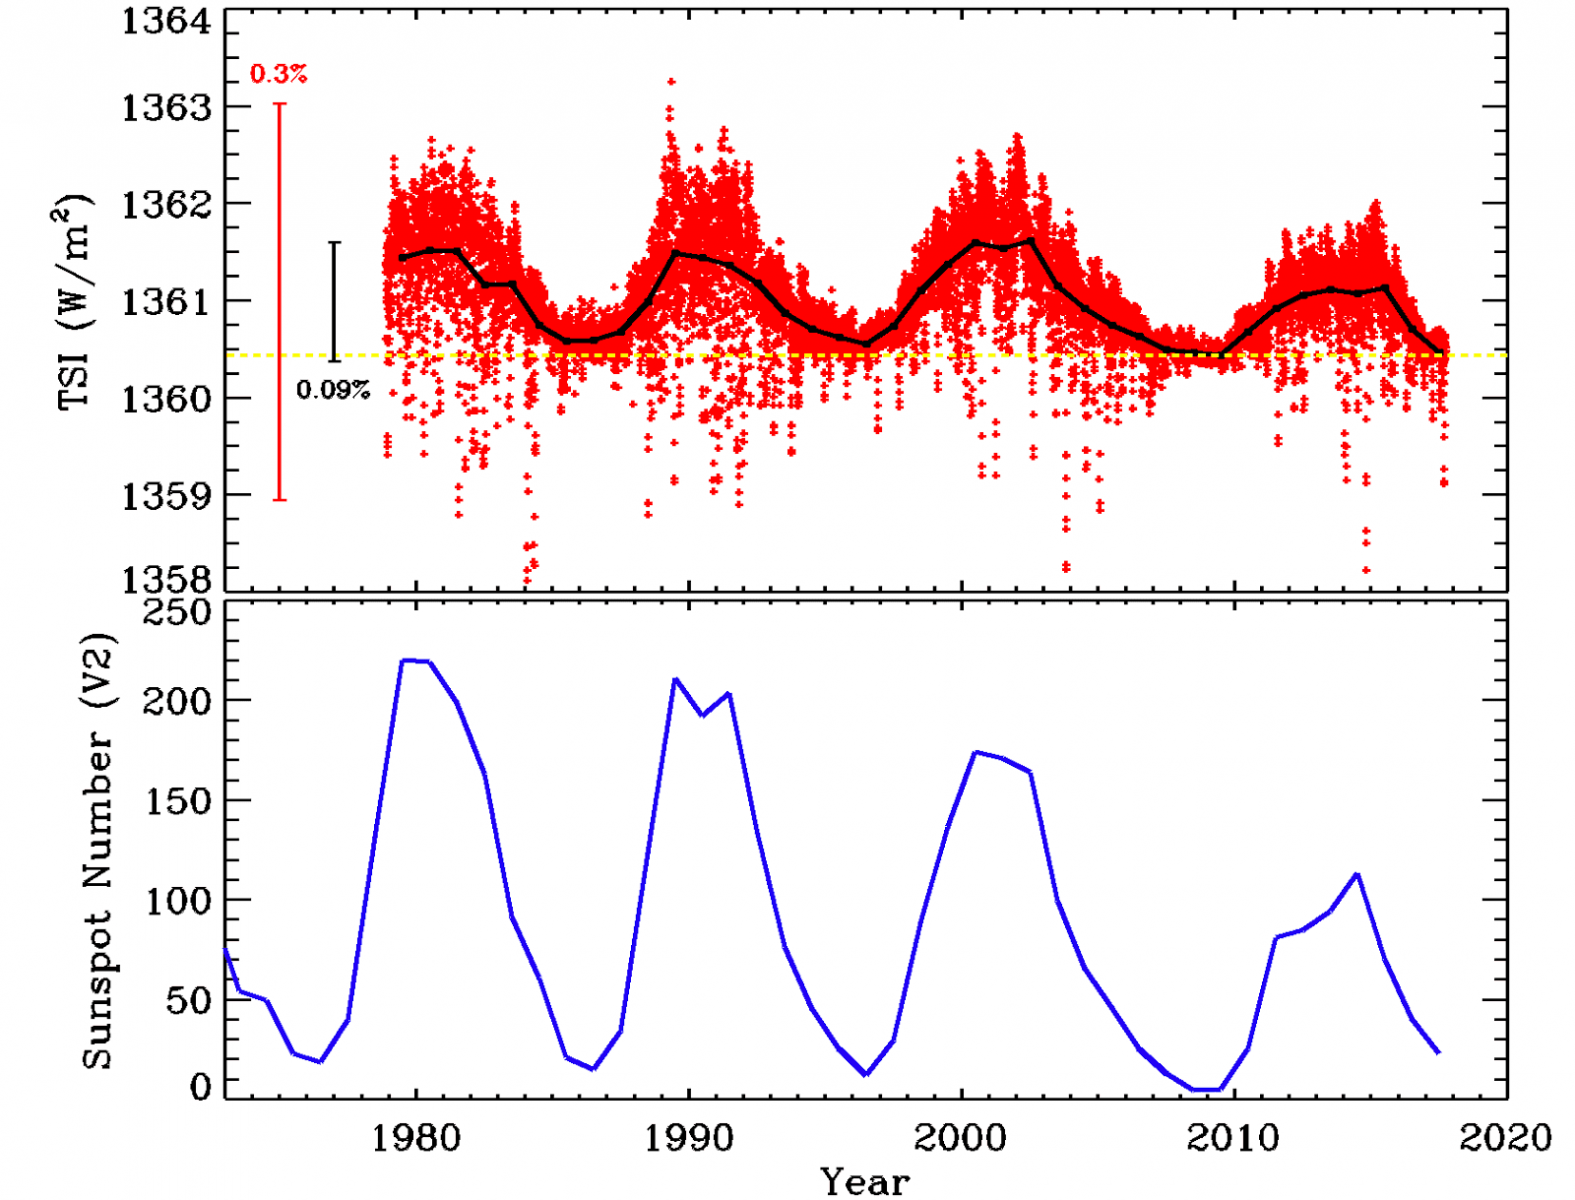
Sunspot Number and Total Solar Irradiance 1978 – 2017. Credit: SDO
In the top plot, scientists at NASA's Solar Dynamics Observatory drew the daily average of measured TSI points in red (14 187 points). On the left is a red vertical bar showing a 0.3% change in TSI. The black curve is the average of TSI over each year. The dashed horizontal line shows the minimum value of year-averaged TSI data. The vertical black bar shows the 0.09% variation we see in that average. The bottom plot shows the annual sunspot number from the SIDC in Belgium in blue.
What do we learn from these plots?
First, the Total Solar Irradiance does change. "That’s why we stopped calling it the solar constant," SDO explains.
Second, as the sunspot number increases, so does TSI. But the converse is also true. As the sunspot number decreases so does TSI.
"We have watched this happen for four sunspot cycles," SDO scientists say. "This waxing and waning of TSI with sunspot number is understood as a combination of dark sunspots reducing TSI below the dashed line and long-lived magnetic features increasing TSI. SORCE has even observed flares in TSI.
"Third, the horizontal dashed line is not an average, it is drawn at the lowest value in the year-averaged TSI data (that happened in 2009). When there are no sunspots the Sun’s brightness should be that of the hot, glowing object we always imagined it to be. We would expect TSI to be the same at every solar minimum. There is much discussion over whether the value of TSI at solar minimum is getting smaller with time, but it is not getting larger.
"These data show us that the Sun is not getting brighter with time. The brightness does follow the sunspot cycle, but the level of solar activity has been decreasing the last 35 years. The value at minimum may be decreasing as well, although that is far more difficult to prove. Perhaps the upcoming solar minimum in 2020 will help answer that question," SDO concludes.
Grand Solar Minimum.
I'm a dedicated researcher, journalist, and editor at The Watchers. With over 20 years of experience in the media industry, I specialize in hard science news, focusing on extreme weather, seismic and volcanic activity, space weather, and astronomy, including near-Earth objects and planetary defense strategies. You can reach me at teo /at/ watchers.news.
Please keep these predictions in mind. They will come out to be totally wrong just like all previous predictions . Let me assure you that the Sun will unleash monster solar flares in the next a few months much stronger than the flares that were released last September.remember that solar physicists were thinking that the sun activity in the bottom of solar minimum when those huge flares unleashed