
Large fractures observed in the Arctic sea ice
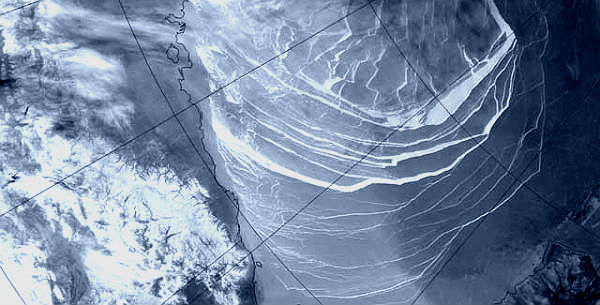
Image credit: TW
Large fractures in the sea ice were observed off the north coast of Alaska and Canada, from near Ellesmere Island in the Canadian Arctic to Barrow in Alaska, during the end of February and continuing into early March.
According to the National Snow and Ice Data Center (NSIDC), this fracturing event appears to be related to an unusual storm that passed over the North Pole on February 8, 2013, which created strong off-shore ice motion. A similar patterns were seen in early 2011 and 2008 but the 2013 fracturing is quite extensive.
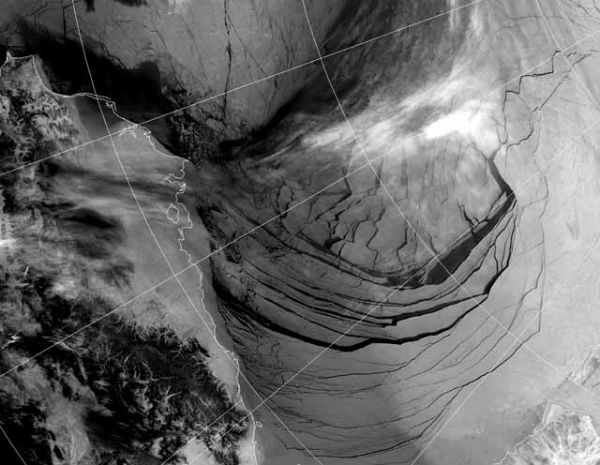 Satellite image captured the ice in the Beaufort Sea coming apart at the seams on February 27, 2013 (Credit: Econnexus)
Arctic sea ice is nearing its winter maximum and will soon begin its seasonal decline. Ice extent remains below average, in part a result of the persistence of the negative phase of the Arctic Oscillation that has kept winter temperatures warmer than average.
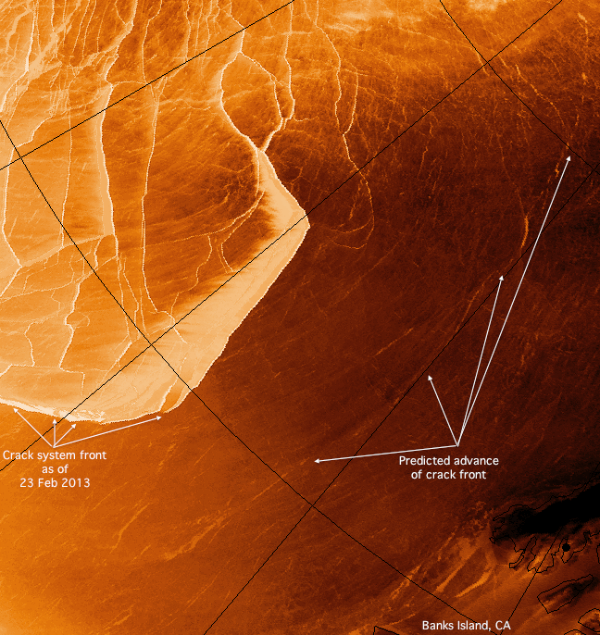 Channel 4 AVHRR infrared imagery shows cracks at Banks Island, Canada (Credit: A-Team)
Following video shows the series of images from February 13 to March 2, 2013, acquired by the Moderate Resolution Imaging Spectroradiometer (MODIS). A large crack can be seen expanding in the sea ice near the coasts of Canada and Alaska. (Black areas indicate where the satellite instrument did not collect data due to lack of sunlight. The dark area decreases as the sun rises in the Arctic.)
NSDIC reported that average sea ice extent for February 2013 was 14.66 million square kilometers (5.66 million square miles). This is 980,000 square kilometers (378,000 square miles) below the 1979 to 2000 average for the month, and is the seventh-lowest February extent in the satellite record. Air temperatures at the 925 hPa level were 2 to 5 degrees Celsius (4 to 9 degrees Fahrenheit) higher than average across the Atlantic sector of the Arctic, especially near Iceland and in Baffin Bay. The dominant feature of Arctic sea level pressure for February 2013 was unusually high pressure over the East Greenland and Barents seas, consistent with a predominantly negative phase of the Arctic Oscillation.
Video bellow shows the sea ice volume modeled by PIOMAS and observed by CryoSat-2.
Sources: National Snow and Ice Data Center, Arctic Sea Ice Blog, A-Team
Can’t wait til all that methane gas makes us choke on our own monetary system. Our last thoughts will be, what did we do to deserve this?