
Retreat of Crane Glacier on Antarctic’s Larsen-B ice shelf
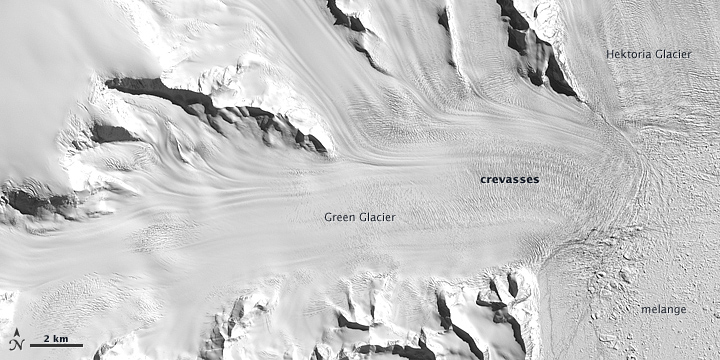
Image credit: TW
Hektoria and Crane glaciers on the Antarctic Peninsula have continued thinning since the Larsen-B ice shelf’s collapse in 2002. They are considered to be among some of the fastest changing in recent years. Almost the entire Larsen B Ice Shelf splintered and collapsed in just over one month period. Researchers had never witnessed such a large area—3,250 square kilometers (1,250 square miles) disintegrate so rapidly.
The collapse of the Larsen appears to have been due to a series of warm summers on the Antarctic Peninsula, which culminated with an exceptionally warm summer in 2002. Significant surface melting due to warm air temperatures created melt ponds that acted like wedges; they deepened the crevasses and eventually caused the shelf to splinter.
An ice shelf is a thick floating tongue of ice, fed by a tributary glacier, extending into the sea off a land mass. Previous research showed that the recent collapse of several ice shelves in Antarctica led to acceleration of the glaciers that feed into them.

According to recent research published in the Journal of Glaciology, the 15 glaciers that flow into the Larsen-B ice shelf have lost more than 10 million tons of mass per year. The longest tributary glacier is Crane Glacier on the northern edge of Larsen B drainage basin, which has retreated by more than 12 km (7 miles) since the collapse of ice shelf. The Crane Glacier underwent 90 meters of thinning in 2004-2005, and its total elevation change – 180 meters – rivals that which has occurred at Hektoria and Green in recent years.
Between 2002 and 2006, Hektoria and Green glaciers lost an average of 4.2 gigatons of ice per year; between 2006 and 2011, they lost 5.6 gigatons per year. In their lower reaches, the two glaciers have lost about 220 meters (720 feet) of vertical thickness since 2002. The Evans, Punchbowl, and Jorum glaciers have also thinned over the years, though not as much dramatic.

While the collapse of the Larsen B was unprecedented in terms of scale, it was not the first ice shelf on the Antarctic Peninsula to experience an abrupt break up. The northernmost section of the Larsen Ice Shelf Complex, called Larsen A, lost about 1,500 square kilometers of ice in an abrupt event in January 1995. Following the even more spectacular collapse in 2002, the Larsen A and B glaciers experienced an abrupt acceleration, about 300% on average, and their mass loss went from 2–4 gigatons per year in 1996 and 2000 (a gigaton is one billion metric tonnes), to between 22 and 40 gigatonnes per year in 2006.

NASA Earth Observatory image created by Jesse Allen and Robert Simmon, using EO-1 ALI data provided courtesy of the NASA EO-1 team.
To put things in proportion when Larsen B was about 11 billion tons sounds. This sounds like a lot of ice but it is equal to 11 cubic kms of ice. The antarctic is covered by about 30 million cubic kms of ice. 11 cubic kms is not that significant.
I am indebted to TomRude comments at WUWT
July 26, 2011 at 9:23 am
“FACT: The largest known ice island measured 31,000 km2 (335 km x 97 km) broke away from the Filchner Shelf in 1956 and was reported by the USS Glacier on November 12, 1956.
Larsen B-15 by comparison is 295 x 37 km.”
Could this be all just a natural phenomena? Without a considerable amount of historical evidence (at least 1,000 years) we can not judge. The few decades of measurements that are available are no reason to cause alarm.
Also there is known to be an active underwater subduction zone not too far from this area, could this be where the heat comes from?