
GNSS measurements reveal a subtle change in Earth’s global figure
Global GNSS measurements show that Earth’s solid surface changed systematically between 1997 and 2015, with vertical motion at high and low latitudes producing a measurable shift in its global geometry. Polar uplift increased from about 0.5 mm/yr (0.02 inches/yr) in the late 1990s to nearly 1 mm/yr (0.04 inches/yr) in 2011–2015, according to research published on September 9, 2026.
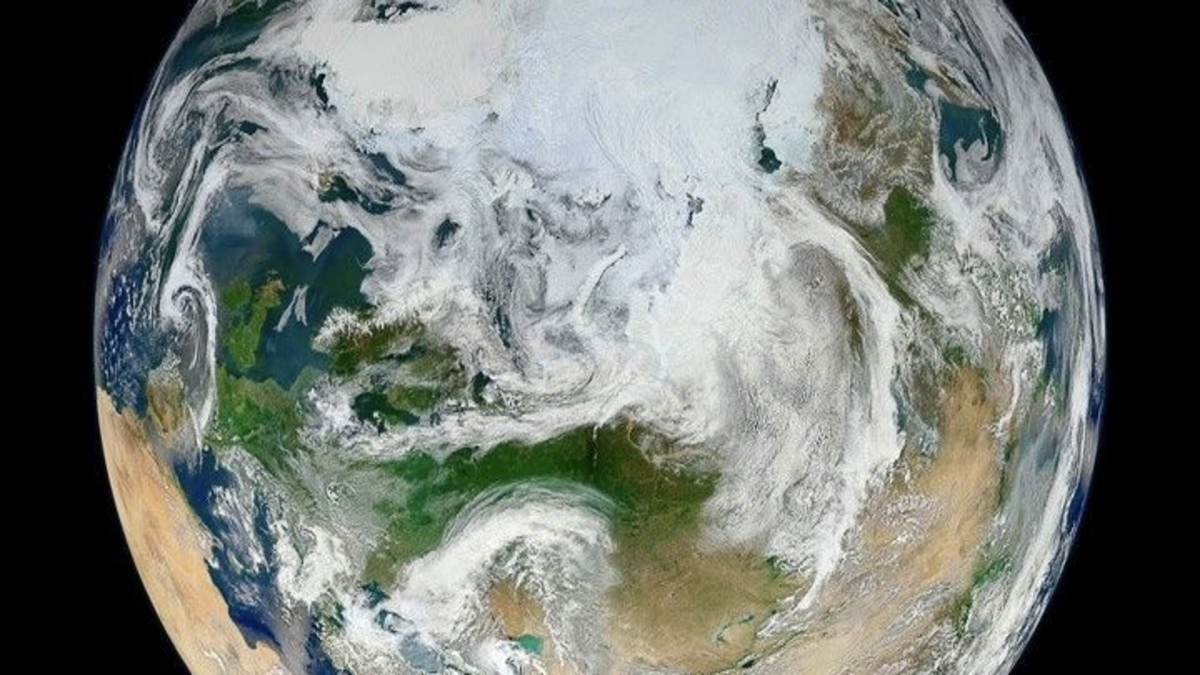
Global GNSS measurements indicate that Earth's solid surface became slightly less flattened between 1997 and 2015, as polar uplift increased while equatorial regions subsided. Credit: NASA
The result matters because the deformation does not tell the same story as Earth’s gravity field. GNSS measures the physical movement of the solid surface, while gravity measurements respond both to deformation and to mass redistributed through the Earth-ocean system. Comparing the two reveals that Earth’s surface geometry and its mass-sensitive gravitational figure can evolve differently at the same time.
Kotsakis (2026), writing in the Journal of Geophysical Research: Solid Earth, analyzed global vertical velocities measured with Global Navigation Satellite Systems. Across four periods from 1997 to 2015, the polar component became increasingly positive while the equatorial component moved in the opposite direction.
Together, those motions produced an acceleration of about 0.4 mm/yr per decade (0.016 inches/yr per decade) in the degree-2 signal used to describe changes in the solid Earth’s flattening.
Earth is naturally oblate, meaning it is slightly compressed along its rotational axis and wider around the equator. Greater radial expansion toward the poles combined with subsidence toward the equatorial region therefore corresponds to a small reduction in the flattening of the solid surface.
The change is extremely small in everyday terms. It occurs at millimeter-per-year rates, but GNSS networks can resolve motions of this scale across large parts of the planet and reveal whether the pattern changes over time.
The more unusual result emerges when the geometric signal is compared with Earth’s gravity field.
After removing modeled glacial isostatic adjustment and translating the remaining deformation through an elastic-loading model, Kotsakis inferred that the contribution to the rate of change of J2 increased from about 0.8 × 10⁻¹⁰ yr⁻¹ during 1997–2000 to 2.7 × 10⁻¹⁰ yr⁻¹ during 2011–2015.
J2 is a coefficient describing the dominant degree-2 component of Earth’s gravity field and is closely related to the planet’s equatorial mass bulge. A positive change corresponds to increasing oblateness of the gravity-defined figure, or geoid.
That means the two measurements point in apparently opposite directions: the solid surface became slightly less flattened, while the inferred gravity-field contribution became more oblate.
The difference is physically possible because surface geometry and mass distribution are not the same quantity.
Loss of ice at high latitudes removes weight from the crust and contributes to uplift. Water transferred into the oceans redistributes mass toward lower latitudes and loads other parts of the solid Earth. GNSS measures how the crust moves geometrically, while the gravity field responds to both that deformation and the relocation of mass.
The study used vertical velocities from the ITRF2014 reference-frame solution, supplemented by selected polar stations from ITRF2020. The analysis involved a time-varying network of 886 GNSS stations, including 43 sites with multiple vertical-velocity estimates.
Because those stations are unevenly distributed, the researchers interpolated the measurements onto global grids using several methods and tested the resulting biases with synthetic deformation fields based on glacial isostatic adjustment models. Coverage remains substantially poorer across polar and oceanic regions than across North America, Europe, and parts of Asia.
Modeled glacial isostatic adjustment produced less than about 0.3 mm/yr (0.012 inches/yr) of polar uplift in the models tested, below the rates recovered from the GNSS observations.
Kotsakis interprets the difference as evidence that additional contemporary processes contribute to the measured global deformation. Accelerating cryospheric mass loss provides one physically consistent contribution, while hydrological and ocean-mass redistribution, rotational loading, and longer-term Earth dynamics also affect the vertical-motion field.
The GNSS result therefore cannot be reduced to a single statement that ice loss is “making Earth rounder.” The observations contain several overlapping deformation signals, while the gravity-field calculation also depends on the elastic-Earth approximation used to translate surface deformation into mass-sensitive quantities.
The comparison has broader value because GNSS and satellite gravimetry observe different parts of the same Earth-system response. GRACE and GRACE-FO measure changes in gravity associated with moving water and ice, while GNSS records how the solid surface responds. Combining those observations can place stronger constraints on where mass moves and how the planet deforms in response.
The record analyzed in the study ends in 2015 and does not establish that the same acceleration continued unchanged through 2026. Sparse high-latitude coverage, gridding sensitivity, GIA corrections, and incomplete separation of elastic and viscoelastic deformation remain important limitations.
Newer GNSS observations, particularly from polar regions, provide the next test: whether the global deformation pattern identified between 1997 and 2015 continued, weakened, or changed as cryospheric and hydrological mass redistribution evolved.
References
1 Kotsakis, C. (2026). Mapping global GNSS vertical velocities to solid Earth figure change. Journal of Geophysical Research: Solid Earth, 131(9), e2026JB034224. https://doi.org/10.1029/2026JB034224

I’m a science journalist and researcher at The Watchers, contributing to the Epicenter edition, where I cover peer-reviewed scientific research and emerging discoveries across Earth and space sciences. With a background in astronomy and a passion for environmental science, I’ve worked in shark and coral conservation in Fiji, conducting reef and shark-behavior research, contributing to mangrove restoration, and earning PADI Open Water and Coral Reef Certifications. I bring a blend of scientific rigor and storytelling to illuminate the discoveries shaping our planet and beyond.
Published in the last 24 hours
- CPC posts a slight risk of heavy rain from the Gulf Coast to the Northeast urban corridor November 25-29, and a moderate risk of West Coast wind and Sierra snow on November 25
- Florida's east coast faces a moderate flash flood risk Wednesday through Friday, with 4 to 8 inches of rain forecast and the St. Johns River near Cocoa already in major flood at 17.13 feet
- Cyclone Akvan to make landfall between Nellore and Visakhapatnam around noon on November 20, IMD forecasts 120-130 km/h winds gusting to 145
- Radio pulses every 7.9 minutes reveal binary with white dwarf and Sun-like star Epicenter
