
Global rainfall is becoming concentrated into fewer event-days, study find
An analysis of daily observations from 19 183 rain-gauge stations found that half of annual precipitation is being delivered over increasingly compressed periods across much of the global station network. Between 1980 and 2022, the consecutive wettest events supplying half of yearly precipitation spanned 27.8 days on average, while that duration declined globally by 0.4 days per decade, according to Su et al. (2026).
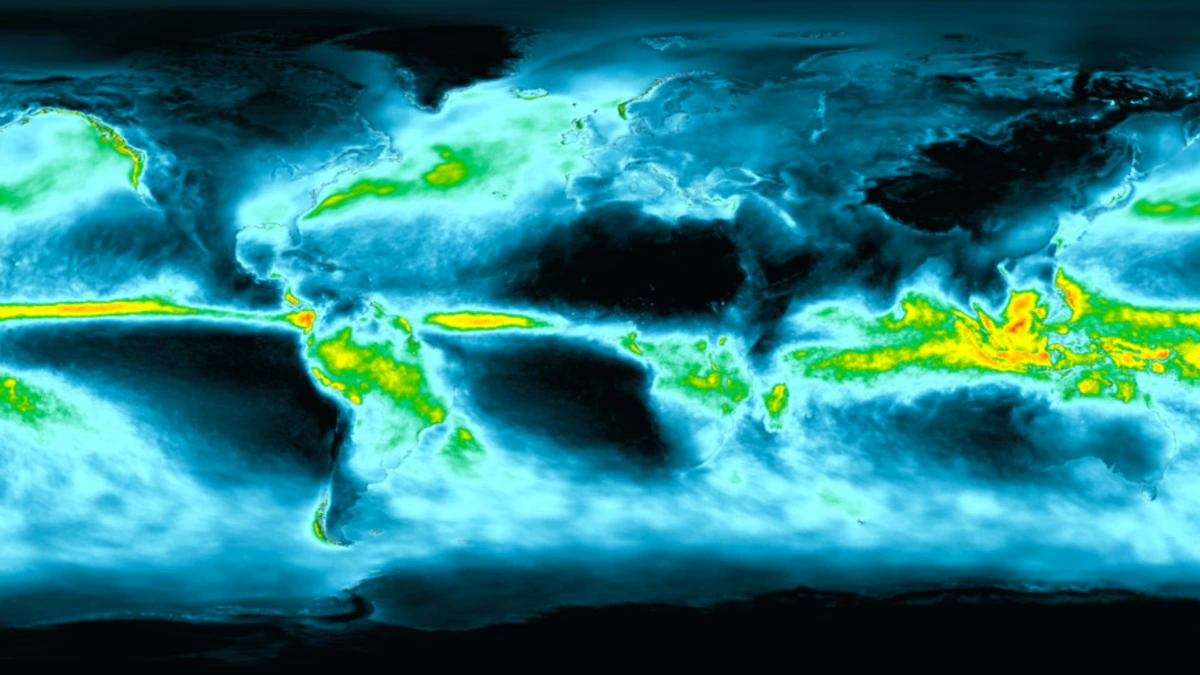
climatology for 2001–2022, showing the average geographic distribution of rain and snowfall. Illustrative image; the Su et al. study used gauge observations rather than this satellite dataset. Credit: NASA's Scientific Visualization Studio
The result describes a change in how precipitation is organized through time rather than a universal increase in the amount of rain produced by individual events. A significant decline was detected at 45.7% of the stations included in the analysis, while 9.8% recorded a significant increase and 44.5% showed no significant trend.
Su et al. (2026) developed an event-based measure called WE50, defined as the cumulative duration of the wettest consecutive precipitation events required to deliver approximately half of annual wet-day precipitation. Across the available global station network, that half was supplied by an average of 9.4 ± 2.8 selected events extending across 27.8 ± 10.3 event-days.
The selected consecutive events lasted 3.0 ± 0.7 days on average and contributed 53.7 ± 31.5 mm (2.1 ± 1.2 inches) of precipitation per event. The researchers used WE50_duration to describe their mean duration and WE50_intensity to describe the mean precipitation contribution from each selected event. WE50 intensity is an event-total measure, not a conventional rainfall rate such as mm/h.
The mean duration of the selected consecutive events declined globally by 0.06 days per event per decade, equivalent to about 86 minutes per event per decade. Significant decreases occurred at 38.3% of stations, with mean regional trends of -0.08 days per event per decade in Europe and -0.10 days per event per decade in South America.
The number of events required to reach half of annual precipitation changed much less. Global WE50 event showed no significant trend, at -0.01 events per decade, while Oceania recorded a significant decline of 0.2 events per decade. The global reduction in WE50 was therefore associated mainly with shorter consecutive-event duration rather than a widespread reduction in the number of contributing events.
The distinction is important because a shorter WE50 does not mean that the selected precipitation events became wetter everywhere. Global WE50 intensity declined by 1.3 mm (0.05 inches) per event per decade. Europe recorded a decline of 0.4 mm (0.02 inches) per event per decade and South America 2.7 mm (0.11 inches), while Asia recorded an increase of 0.9 mm (0.04 inches) per event per decade.
Europe and South America therefore became more temporally concentrated even while the mean precipitation contribution from each selected event remained stable or weakened. Shorter event duration accounted for much of the change in those regions. Oceania followed a different pattern, where changes in precipitation amount contributed more strongly to the decline in WE50.
The event-based method was designed to retain information that conventional wet-day metrics lose. A measure based only on individual wet days can identify which days supply a large share of annual precipitation, but it cannot show whether those days occurred independently or formed part of the same multi-day precipitation episode.
The researchers compared WE50 with WD50, the number of individual wettest days required to provide half of annual precipitation. WD50 identified 18.6 ± 7.1 wet days globally, and 93.0 ± 2.0% of days selected by WE50 overlapped with WD50 days. Stations with similar WD50 values still showed substantial differences in how those days were organized into consecutive events.
Event organization has hydrological relevance because several consecutive days of rainfall can affect soils, catchments and river systems differently from isolated wet days. The authors discuss possible implications for floods, drought and water management, but the analysis did not measure whether the detected WE50 trends caused changes in flood or drought occurrence. Directly connecting event-based precipitation concentration with hydrological responses remains a separate research problem.
The station analysis drew on several gauge datasets and national observational records. The researchers initially assembled 39 199 stations and retained 19 183 after requiring more than 30 years of daily observations during 1980–2022, fewer than 10% missing daily values over the full period and adequate annual completeness.
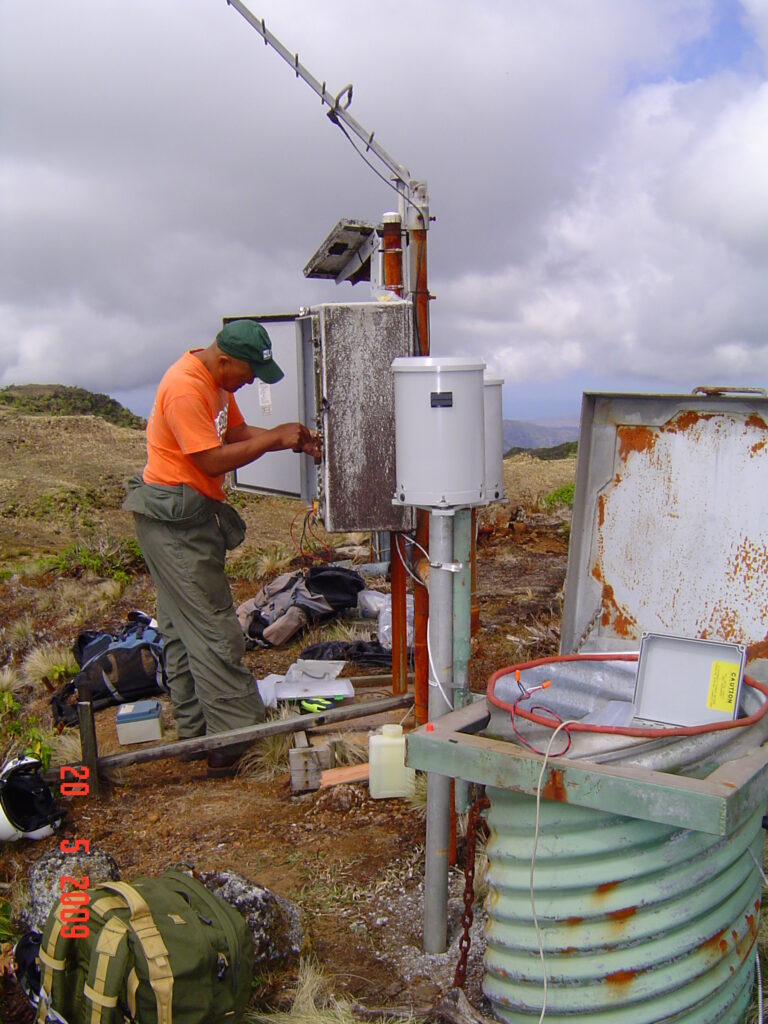
Africa was excluded from the continental-scale analysis because the available network did not contain enough long-duration, high-quality records for the regional comparison. Gauge coverage was also uneven between other continents, which means densely monitored regions have greater representation in aggregated statistics than areas with sparse observations.
The researchers defined a consecutive precipitation event using a locally adaptive threshold based on the 1981–2010 mean daily precipitation on wet days at each station. They then repeated the analysis using a fixed threshold of 1 mm (0.04 inches) per day. The alternative definition changed the absolute values but left the main geographic and trend patterns broadly similar.
Under the fixed 1 mm (0.04 inches) threshold, global WE50 increased from 27.8 ± 10.3 days to 33.1 ± 13.9 days, while WE50_event declined from 9.4 ± 2.8 to 8.4 ± 2.2 events. The sensitivity test showed that the magnitude of the metrics depends on how consecutive events are defined, while the principal regional contrasts remained similar.
The study decomposed changes in WE50 into contributions from event duration, annual precipitation amount and mean precipitation contribution per selected event. At the global scale, 68.9% of stations had decreasing WE50 slopes, with a median decline of 2.1% per decade. The largest negative component came from shorter event duration, which contributed -1.5% per decade to the median change.
Europe and South America showed similar decompositions, with event-duration contributions of -2.6% per decade in both regions. In Oceania, the precipitation-amount component contributed -3.3% per decade and accounted for more of the change, while Asia and North America showed stronger compensation among the different components.
The authors describe that decomposition as diagnostic rather than causal. Changes in precipitation amount, event duration and per-event contribution can offset one another, and the analysis does not establish that any single component directly caused particular floods, droughts or other hydrological disasters.
Long-term observations will be needed to determine how changes in consecutive-event organization translate into river discharge, soil moisture, agricultural water availability and flood behavior. The present results establish that precipitation timing has shifted across a large part of the available gauge network, while the hydrological consequences of that reorganization remain less directly constrained.
References:
1 Su, J., Miao, C., Hu, J., Ji, J., Zhao, Y., & Gou, J. (2026). Global changes in precipitation concentration through consecutive event organization. Earth’s Future, 14(10), e2026EF008471. DOI: 10.1029/2026EF008471

I’m a science journalist and researcher at The Watchers, contributing to the Epicenter edition, where I cover peer-reviewed scientific research and emerging discoveries across Earth and space sciences. With a background in astronomy and a passion for environmental science, I’ve worked in shark and coral conservation in Fiji, conducting reef and shark-behavior research, contributing to mangrove restoration, and earning PADI Open Water and Coral Reef Certifications. I bring a blend of scientific rigor and storytelling to illuminate the discoveries shaping our planet and beyond.
