
Extreme fire-smoke exposure days rise from 16 to 66 per year globally since the 1990s
Global population-weighted exposure to extreme fire-related PM2.5 increased sharply between 1990 and 2018, with days exceeding a fixed extreme threshold rising from an average of 16 per year in the 1990s to 66.1 per year during 2010–18, according to research cited in the World Meteorological Organization’s latest Air Quality and Climate Bulletin released on September 7, 2026. The bulletin also found above-average PM2.5 concentrations associated with increased fire activity across several regions in 2025, while industrial and transport-related particulate pollution continued to decline in parts of Europe and North America.
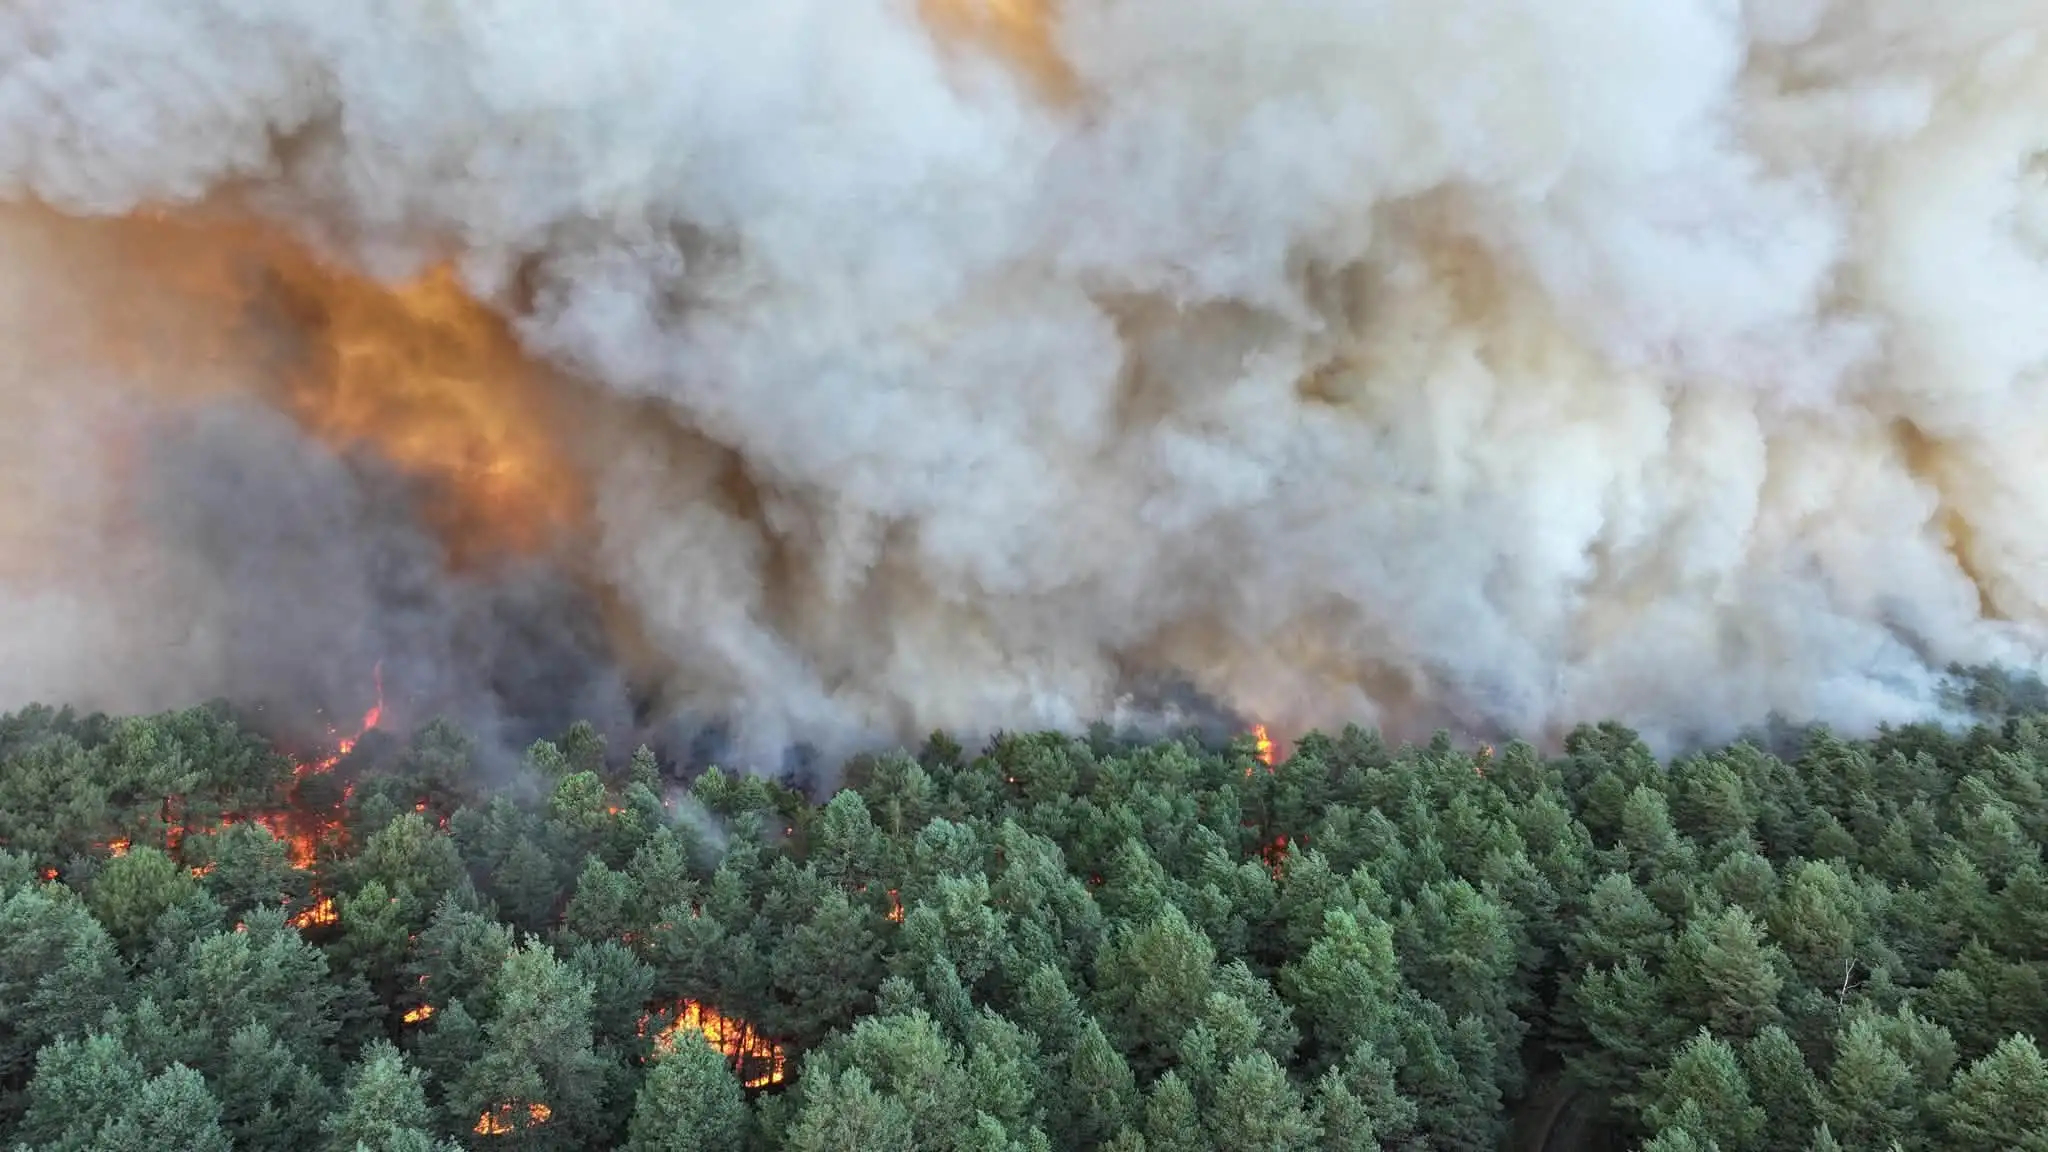
Aerial firefighting operations over the Fontainebleau wildfire in Seine-et-Marne, France. Credit: SDIS 77
The 2025 analysis showed northern Canada, part of the Russian Federation, and western-central Africa above their long-term PM2.5 averages in association with increased fire activity. Northwestern Spain was another hotspot after exceptional fires in late summer. Burning in Amazonia was relatively lower than in previous years, while PM2.5 remained below its long-term average in China and above average in India, where biomass burning and other pollution sources contributed to elevated concentrations.
The sixth edition of WMO’s Air Quality and Climate Bulletin examines air quality during 2025 and its interaction with climate, drawing on data and information associated with the organization’s Global Atmosphere Watch program. For the first time in the series, the global PM2.5 assessment incorporated modeling from four different systems. WMO said their results were broadly comparable and mostly consistent despite differences in model structure and input data.
PM2.5 consists of particles and liquid droplets with diameters below 2.5 μm. Sources include industry, agriculture, residential heating, transport, fires, and dust, and the particles are small enough to penetrate deeply into the respiratory system. WMO’s 2026 bulletin places increasing fire-related exposure alongside longer-running reductions in particulate emissions from industrial and transport sources in Europe and North America.

Chowdhury et al. (2025) used the Finnish Meteorological Institute’s SILAM chemical transport model, anthropogenic emissions data, and the IS4FIRES fire information system to reconstruct population exposure to fire-related PM2.5 between 1990 and 2018. The study, published in npj Clean Air, provides the long-term fire-smoke results cited by WMO.
The WMO bulletin and the study describe extreme fire-PM2.5 exposure as having “tripled” since the 1990s. The underlying model results show that the average number of days per year above the 1990–94 extreme threshold increased from 16 during 1990–99 to 45.8 during 2000–09 and 66.1 during 2010–18. The latter value is approximately 4.1 times the 1990s average.
Extreme fire-PM2.5 exposure increased across most of the regions analyzed. The strongest increases included parts of sub-Saharan Africa, Tropical Latin America and Eastern Europe, while the contribution of fires to total PM2.5 increased over time across much of Europe, North America and South America. The authors reported that population-weighted all-source PM2.5 declined in Europe and high-income North America during the study period even as fire-PM2.5 exposure increased.
WMO said increased pollution from wildfires risks undermining efforts to improve air quality, especially where reductions in other PM2.5 sources occur alongside rising fire-related exposure. The npj Clean Air analysis found that the relative contribution of fire-PM2.5 increased in several regions where all-source fine-particle exposure declined.
The same analysis estimated that acute exposure to fire-PM2.5 contributed to an average 99 000 all-cause deaths per year during 2010–18, with a 95% confidence interval of 55 000–149 000. The figure is a model-based estimate of attributable mortality rather than a directly counted death toll. The researchers combined modeled exposure with spatially varying epidemiological risk relationships to derive the burden.
Alari et al. (2025) analyzed daily mortality across 654 subnational regions in 32 European countries, covering a population of about 541 million people, and combined the records with modeled fire-related and non-fire-related PM2.5 concentrations for 2004–22. The study was published in The Lancet Planetary Health.
The researchers found larger mortality associations for fire-related PM2.5 than for non-fire-related PM2.5. When they estimated deaths attributable to fire-related particles using the relative risk for total PM2.5 instead of the fire-specific relationship, attributable mortality was underestimated by 93%. Pooled cumulative relative risks over lags of 0–7 days per 1 μg/m3 increase in fire-related PM2.5 were 1.007 for all-cause mortality, 1.009 for cardiovascular mortality, and 1.013 for respiratory mortality.
WMO incorporated the finding into its warning that conventional air-quality risk assessments can fail to capture differences associated with wildfire smoke. The bulletin also calls for improved atmospheric observations of fine particulate matter, ground-level ozone, black carbon and other aerosols, noting that important components of atmospheric pollution remain inadequately monitored.
Fire smoke is one part of the air-quality and climate interaction described in the bulletin. WMO reports that high temperatures, stagnant atmospheric conditions and strong solar radiation favor the production of ground-level ozone. Studies of heatwave conditions in the southeastern United States, Europe and China form part of its assessment of increasing ozone-related health risk.
WMO said the interaction between rising fire exposure, heat-driven ozone formation, and other forms of atmospheric pollution means that air-quality and climate policies cannot be addressed independently, while gaps in sustained aerosol observations continue to limit assessment of several emerging pollutants
References:
1 WMO Air Quality and Climate Bulletin No. 6 – September 2026 – WMO – September 7, 2026
2 Chowdhury, S., Hänninen, R., Uppstu, A., Sofiev, M., & Aunan, K. (2025). Global health burden from acute exposure to fine particles emitted by fires. npj Clean Air. https://doi.org/10.1038/s44407-025-00024-7
3 Alari, A., Ballester, J., Milà, C., Benmarhnia, T., Sofiev, M., Uppstu, A., Hänninen, R., & Tonne, C. (2025). Quantifying the short-term mortality effects of wildfire smoke in Europe: A multicountry epidemiological study in 654 contiguous regions. The Lancet Planetary Health, 9(8), 101296. https://doi.org/10.1016/j.lanplh.2025.101296

I’m a science journalist and researcher at The Watchers, contributing to the Epicenter edition, where I cover peer-reviewed scientific research and emerging discoveries across Earth and space sciences. With a background in astronomy and a passion for environmental science, I’ve worked in shark and coral conservation in Fiji, conducting reef and shark-behavior research, contributing to mangrove restoration, and earning PADI Open Water and Coral Reef Certifications. I bring a blend of scientific rigor and storytelling to illuminate the discoveries shaping our planet and beyond.

Commenting rules and guidelines
We value the thoughts and opinions of our readers and welcome healthy discussions on our website. In order to maintain a respectful and positive community, we ask that all commenters follow these rules.